Silver’s Valuable Insights Into The Upcoming PMs Rally
 share
share
 share
share
 share
share
 share
share
 share
share
The analysis of the precious metals market isn’t just gold analysis – there are times when silver rises to the forefront of everyone’s attention. And we fully expect such a moment of the white metal stealing the spotlight to arrive shortly. What lessons can we draw from the silver chart?
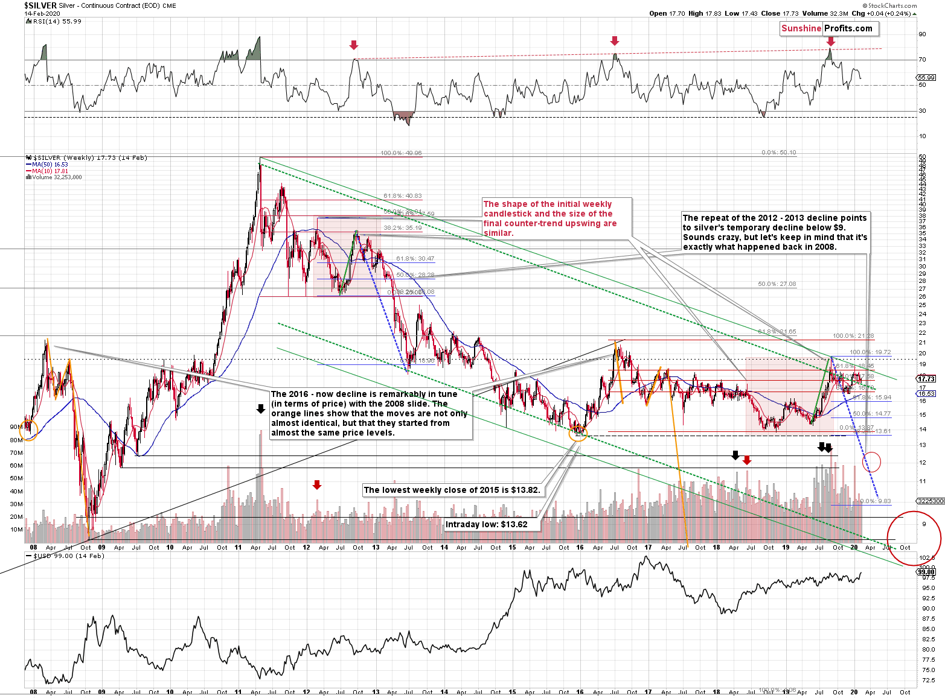
The key analogy in silver (in addition to the situation being similar to mid-90s) continues to be the one between 2008 and the 2016 – now periods.
There is no meaningful link in case of time, or shape of the price moves, but if we consider the starting and ending points of the price moves that we saw in both cases, the link becomes obvious and very important. And price patterns in many markets tend to repeat themselves to a considerable extent. Sometimes directly, and sometimes proportionately.
The rallies that led to the 2008 and 2016 tops started at about $14 and we marked them both with orange ellipses. Then both rallies ended at about $21. Then they both declined to about $16. Then they both rallied by about $3. The 2008 top was a bit higher as it started from a bit higher level. And it was from these tops (the mid-2008 top and the early 2017 top) that silver started its final decline.
In 2008, silver kept on declining until it moved below $9. Right now, silver’s medium-term downtrend is still underway. If it’s not clear that silver remains in a downtrend, please note that the bottoms that are analogous to bottoms that gold recently reached, are the ones from late 2011 – at about $27. Silver topped close to $20.
The white metal hasn’t completed the decline below $9 yet, and at the same time it didn’t move above $19 - $21, which would invalidate the analogy. This means that the decline below $10, perhaps even below $9 is still underway.
Naturally, the implications for the following months are bearish.
Let’s consider one more similarity in the case of silver. The 2012 and the 2018 – today performance are relatively similar, and we marked them with red rectangles. They both started with a clear reversal and a steady decline. Then silver bottomed in a multi-bottom fashion, and rallied. This time, silver moved above its initial high, but the size of the rally that took it to the local top (green line) was practically identical as the one that we saw in the second half of 2012.
The decline that silver started in late 2012 was the biggest decline in many years, but in its early part it was not clear that it’s a decline at all. Similarly to what we see now, silver moved back and forth with lower highs and lower lows, but people were quite optimistic overall, especially that they had previously seen silver at much higher prices (at about $50 and at about $20, respectively).
The 2012 corrective upswings were actually the final chances to exit long positions and enter short ones. It wasn’t easy to do it back then just as it’s not easy to do so right now. But the size of the decline that followed speaks for itself. In investing and tading, what’s pleasant and what’s profitable is rarely the same thing.
Silver’s huge early-January reversal confirms gold’s reversal. Silver’s volume didn’t set a new record, but it was truly big nonetheless. Definitely more than enough to make silver’s reversal important and reliable. It’s very bearish on its own and extremely bearish when examined together with gold’s reversal.
Silver has been very volatile recently, but the overall tendency for silver to outperform gold and mining stocks in the final part of a given rally remains intact. This means that if the precious metals sector is to rally for the next week or so, silver is likely to rally visibly.
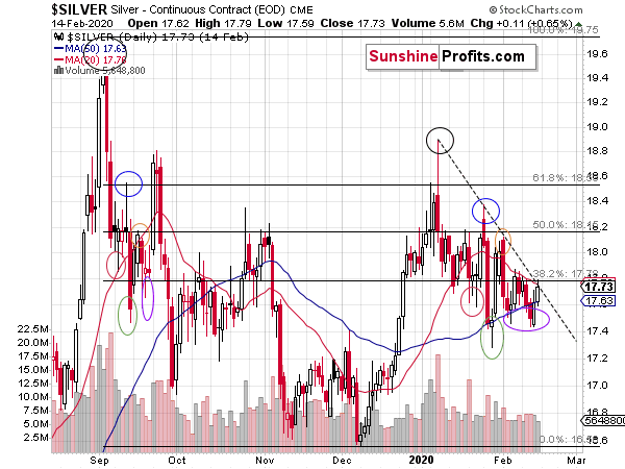
There is something interesting on its chart that we would like to share with you. Namely, silver’s performance so far this year resembles the way silver behaved after the early-September 2019 top.
We marked the analogous price extremes with ellipses of the same color. The tops are in black, the initial lows are in red, the first corrective highs are in blue, then the lowest short-term lows are in green, then the next corrective highs are in orange, and then the final short-term lows are in purple.
If the similarity is to persist, silver is likely to rally particularly well this week.
This is especially the case, given silver’s intraday breakout above the declining dashed resistance line that you can see on the above chart.
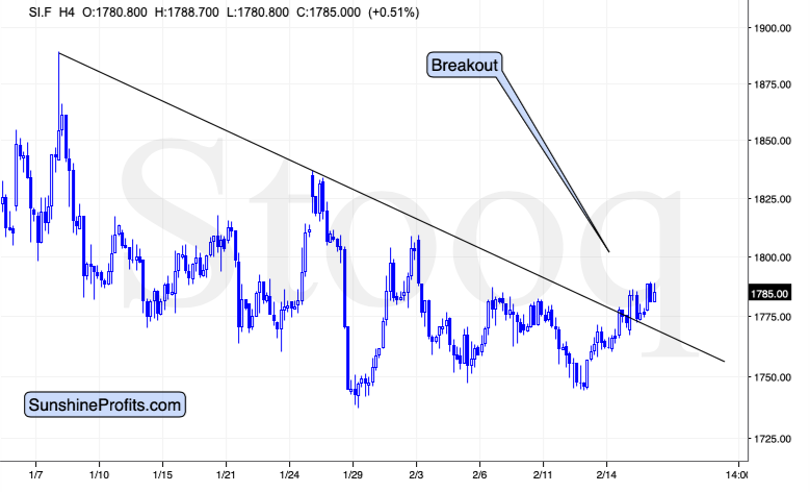
Just as gold broke above its resistance line, silver did the same thing above a different line. The implications are very bullish for the short term. The market just confirmed our decision to advantageously adjust the profit-take levels in silver – and our subscribers already know what that means precisely.
Thank you for reading the above free analysis. It’s part of today’s extensive Gold & Silver Trading Alert. We encourage you to sign up for our free gold newsletter – as soon as you do, you'll get 7 days of free access to our premium daily Gold & Silver Trading Alerts and you can read the full version of the above analysis right away. Sign up for our free gold newsletter today!
Przemyslaw Radomski, CFA
Editor-in-chief, Gold & Silver Fund Manager
Sunshine Profits - Effective Investments through Diligence and Care
* * * * *
All essays, research and information found above represent analyses and opinions of Przemyslaw Radomski, CFA and Sunshine Profits' associates only. As such, it may prove wrong and be a subject to change without notice. Opinions and analyses were based on data available to authors of respective essays at the time of writing. Although the information provided above is based on careful research and sources that are believed to be accurate, Przemyslaw Radomski, CFA and his associates do not guarantee the accuracy or thoroughness of the data or information reported. The opinions published above are neither an offer nor a recommendation to purchase or sell any securities. Mr. Radomski is not a Registered Securities Advisor. By reading Przemyslaw Radomski's, CFA reports you fully agree that he will not be held responsible or liable for any decisions you make regarding any information provided in these reports. Investing, trading and speculation in any financial markets may involve high risk of loss. Przemyslaw Radomski, CFA, Sunshine Profits' employees and affiliates as well as members of their families may have a short or long position in any securities, including those mentioned in any of the reports or essays, and may make additional purchases and/or sales of those securities without notice.
********
share
share
share
share
share
 Przemyslaw Radomski, CFA, is the founder, owner and the main editor of SunshineProfits.com.
More from Silver Phoenix 500