Deutsche Bank Fuels Silver Price
Last week, it was the Fed’s magic boosting up the price of silver. This week, the slow slide in the silver price resumed, going all week except during peak fear about the woes of Deutsche Bank. When it looked bleakest—and the potential size of the capital-eating fines was highest—there was a wicked little rally in the metals, spiking silver up from below $19.10 to $19.70 in a few hours. However, the price reversed just as fast, on news of a settlement with the US Department of Justice.
Folks, what do we know about the price of the monetary metals? But if we had a thought, it would be that when the real run on a major too-big-to-fail bank occurs, the primary flight will be into the dollar, with some capital flows into gold. There will be a rising gold-silver ratio. Not a good time to bet on silver.
In any case, that does not appear to be happening just yet, or at least not the week of Sep 26.
In yet another variant of irony, our running inside joke-slash-point bears repeating for a third week in a row:
Just repeat after me: “the Fed makes the economy more stable.”
A major money center bank is in the throes of, well, the throes of something serious.
As always, the central question to be answered in this Report is simple. Is this a change in the fundamentals of supply and demand? Read on for the only true picture of the fundamentals of the monetary metals. But first, here’s the graph of the metals’ prices.
The Prices of Gold and Silver

Next, this is a graph of the gold price measured in silver, otherwise known as the gold to silver ratio. It was up this week.
The Ratio of the Gold Price to the Silver Price

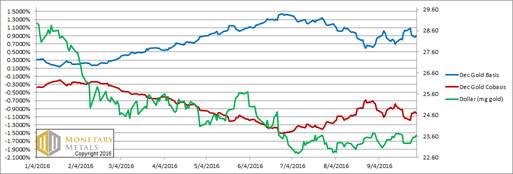
For each metal, we will look at a graph of the basis and cobasis overlaid with the price of the dollar in terms of the respective metal. It will make it easier to provide brief commentary. The dollar will be represented in green, the basis in blue and cobasis in red.
Here is the gold graph.
The Gold Basis and Cobasis and the Dollar Price

Well, the price of gold is down some twenty one bucks (seen as a small rise in the green line, which is the price of the dollar as measured in gold). With that, we see a small rise in the scarcity (red line).
The fundamental price that we calculate—the price at which the metal would clear, absent the leveraged speculators—is down $12, now below $1,300.
Now let’s look at silver.
The Silver Basis and Cobasis and the Dollar Price

The price of silver fell greater than gold, in proportion. There was a slight increase in scarcity at the new price. But not a lot.
We calculate a fundamental price drop of 58 cents, to just above $16.
Yes, the fundamentals call for a price $3.30 below the market price. This does not mean to go out and short silver (we never recommend naked shorting a monetary metal). It does not mean that the price of silver will drop immediately in the morning. If a rumor of crisis at Deutsche could cause the price to spike 60 cents last week, then it could cause it again this week. If traders have simple heuristics of what to buy and what to sell (the silver price chart looks a bit like the inverse of the Deutsche share price chart), then that will not likely change so quickly.
One thing’s for sure, silver is a lousy bet at this price with these fundamentals. Buying silver right now—at least if you’re buying it on speculation of a price gain—is almost the textbook definition of a Ponzi scheme. Previous buyers will only get their capital out if new buyers come along and bid up the price even more. But the only certainty is that one day, they won’t.
© 2016 Monetary Metals


 Dr. Keith Weiner is the CEO of Monetary Metals and the president of the Gold Standard Institute USA. Keith is a leading authority in the areas of gold, money, and credit and has made important contributions to the development of trading techniques founded upon the analysis of bid-ask spreads. Keith is a sought after speaker and regularly writes on economics. He is an Objectivist, and has his PhD from the New Austrian School of Economics. His website is
