Silver Futures Outlook
The silver market has been the talk of metals traders in recent days and weeks after an extraordinary run this year, it's first healthy run in a good 4-5 years. With the dominant short-term time cycles having peaked in the precious metals markets (coinciding with the short-term bottom in equities), what are some of the things we can expect to see in the silver market in the month of July and beyond? These are questions we will try to answer in the following report. September silver futures have experienced a long and impressive upward swing from their December-February double bottom lows near $4.00 to the 2002 high of over $5.10. Since the early June peak in silver, the market pulled back to $4.80 and has been consolidating within a 10 cent range between $4.80 and $4.90. Prices broke out above the $4.90 ceiling last week to close the Independence Day week at $4.95. This presages a couple of possibilities, and the charts are most instructive in presenting us a picture of silver's short-term and intermediate-term price outlook.
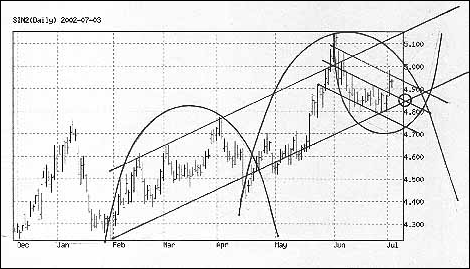
In the immediate-term picture, silver will meet with a great obstacle this week (July 8-12) in trying to overcome the heavy supply that begins at $4.96 and extends all the way up to $5.00. Silver has three things going against it in the next three weeks: 1. Time cycles; 2. Overhead supply; 3. Parabolic pressure. To the latter end, consider the large parabolic dome in the daily chart that began in mid-April and looks to end sometime in the later part of this month. A breakout above $5.00 on a closing basis would be required to penetrate this dome and start a new parabolic cycle, something we consider unlikely in the next few days ahead. It can also easily be seen by connecting the tops of the June peak above $5.10 and the intra-day peak just below $5.00 last week, a declining trend line (representative of supply) will contend with silver rallies early this week around the $4.96 area. A close above $4.96 on Monday or Tuesday of the present week would be the first sign that buyers have more power than we think. This would have to be followed by a close above $5.00 by week's end in order to solidify any counter-cyclical rally attempt. In our estimation the odds of this happening are less than 50%.

So assuming that silver fails to penetrate the $4.96-$5.00 supply area on a closing basis this week, what are the downside projections for the days/weeks ahead? Silver's first important test of support will be met at $4.85, which is a quantum support level (defined by several closes at this level in the recent past, as well as serving as a pivotal point). Not coincidentally, $4.85 also happens to be the extreme lower boundary of a 20-week rising trend channel, plus this trend channel bottom at $4.85 intersects a predicted downward-sloping trend channel first established in May (off the intra-day highs in the latter part of that month). All of these chart indications strengthen $4.85 as being a very important benchmark area and test of market support.
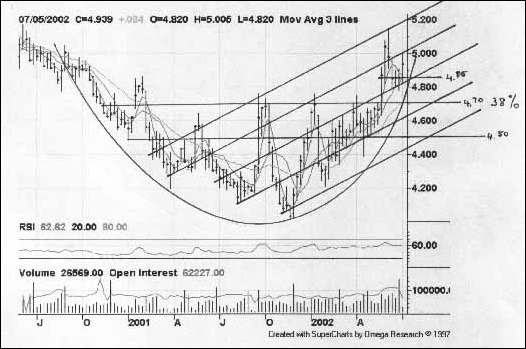
Once silver prices approach $4.85 we will have our first good indication of immediate-term support in July since a failure for $4.85 to hold up under the cyclical pressure this month will prove the immediate-term trend is weak, and this in turn will lead to a test of the next lowest benchmark at $4.70. The $4.70 level also corresponds approximately to the 38% retracement level of the entire move from $4.00 to above $5.10. This is an important Fibonacci retracement and will further test the short-term strength of the silver market. Like the $4.85 level, $4.70 is further strengthened by a crisscrossing of trend lines and channels. Thus, should prices decline this low not only would there likely be immediate buying support but probably an immediate reversal and rally. In the unlikely event that $4.70 failed to hold, the next (and final) support exists at $4.50, the proverbial "line in the sand" in silver's 2002 bull market. Crossing below this level would mean instant death to the bull run in silver this year; however, we view this possibility as considerably less than 50% likely to happen. At its lowest point, silver futures would likely hold at or above $4.70 this month in a correction.

Now here is where things get really interesting. By our analysis, the coming week (July 8-12) is absolutely critical for determining silver's short-term strength or weakness (short-term in this instance defined as 3-4 weeks). As you can see from our weekly silver futures chart, there is an extremely significant parabolic bowl still intact (although just barely) that will be tested early this week. If silver is to rally again this month, when prices touch the rim of this bowl (likely to occur between $4.85-$4.90) there must be an immediate upside move and a penetration above $5.00, otherwise is shows that the bowl no longer has any "juice" left in it and it will be broken. And once a parabolic bowl is broken, it means the upward trend has temporarily been arrested, and a reaction can be expected to follow. Therefore watch closely $4.85 on declines and $4.96-$5.00 on advances to see how prices react around these critical levels in coming days.

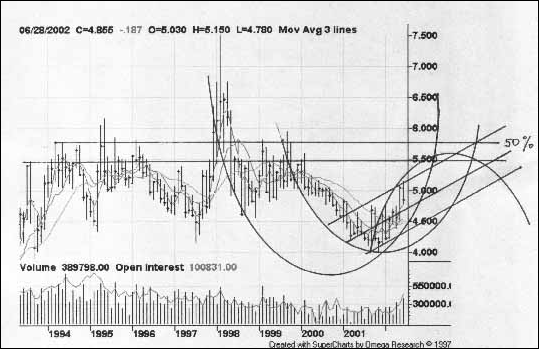
To complete our analysis of the silver futures market, let's examine the long-term monthly chart (above). Looking at the years 1998-2002 and 1999-2002 we see two very distinctive parabolic bowls in the chart, both of which are still intact. The most larger bowl (which began in early 1998) shows immediate support right above $4.50, which we referenced in the above paragraphs as being essential to keeping silver's bullish trend intact this year. This is strengthened by a series of predicted trend channel lines, the center line which intersects $4.70-$4.75 (another critical level we referenced earlier). Assuming this 4 * year type bowl stays intact through July, we can expect perhaps a final upside swing beginning later this summer and probably carrying to at least $5.50 and possibly as high as $5.70-$5.75 at the extremities. This area also represents approximately the 50% retracement level from the early 1998 top to the 2001 lows.


