Silver Looks Ready to Rip
 share
share
 share
share
 share
share
 share
share
 share
share
Last Friday, United States Federal Reserve Chair Jerome Powell said “the time has come” to begin lowering interest rates, a process that will likely begin at the Fed’s Sept. 17-18 meeting.
Markets are widely anticipating a 25-basis-points cut, or even 50 points if the economy looks weak and needs a stronger monetary boost. More reductions could follow before year’s end.
If the Fed follows through, it will cause bond yields to weaken further, the dollar to weaken more and commodity prices to strengthen. When positive real interest rates, which favor bond investors, turn negative, it will especially affect gold and silver prices to the upside.
Spot gold set a record $2,531.60 an ounce last week on Powell’s dovish comments. The buying trend continued into Monday, with the yellow metal hitting $2,514.73, and $2,525.00 as of 17:00 PST, Tuesday.
Gold’s rally, which started in mid-February, is underpinned mostly by increased geopolitical risks, central bank buying and slowing ETF sales.
Silver has gained mostly due to buying in India, China and so-called “paper silver”. Investors in July showed a renewed interest in silver ETFs, which had $300 million in inflows following two months of outflows totaling $1 billion, according to BlackRock’s latest Global ETP Flows report, via ETF.com.
Last week the metal followed gold higher, breaking through $30/oz. So far this year it is up 28% compared to gold’s 23%.
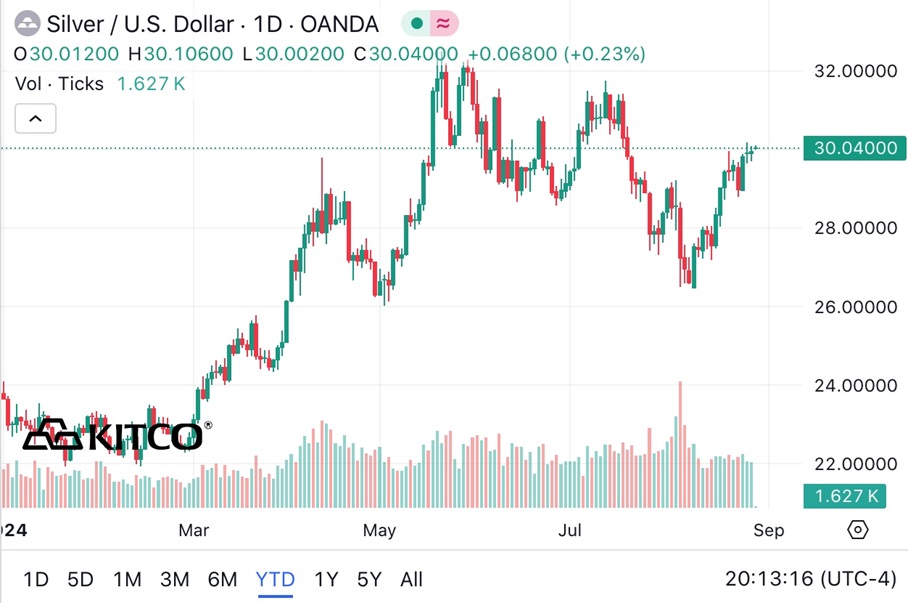
Year to date spot silver. Source: Kitco
The general consensus is that precious metals will continue to thrive over a longer horizon. AOTH’s research into the silver market indicates the metal is due for an upward price correction.
Undervalued silver
Silver and gold largely move together, as both offer similar macro- and currency-hedging properties. While gold has hit record highs this year, silver remains undervalued, says John Ciampaglia, CEO of Sprott Asset Management.
Ciampaglia said with gold now above $2,500, silver prices should trend higher. Silver usually rallies after gold.
“It’s mind-boggling to us that silver is still below $30. It is obviously way off its 2010 highs, and we would love to see it get back to the $50 level,” said Ciampaglia. “We think it has the ability to do that over time.”
Gold-silver ratio
One way to gauge the relative value of gold versus silver is to calculate the gold-silver ratio. Simply divide the spot gold price by the spot silver price.
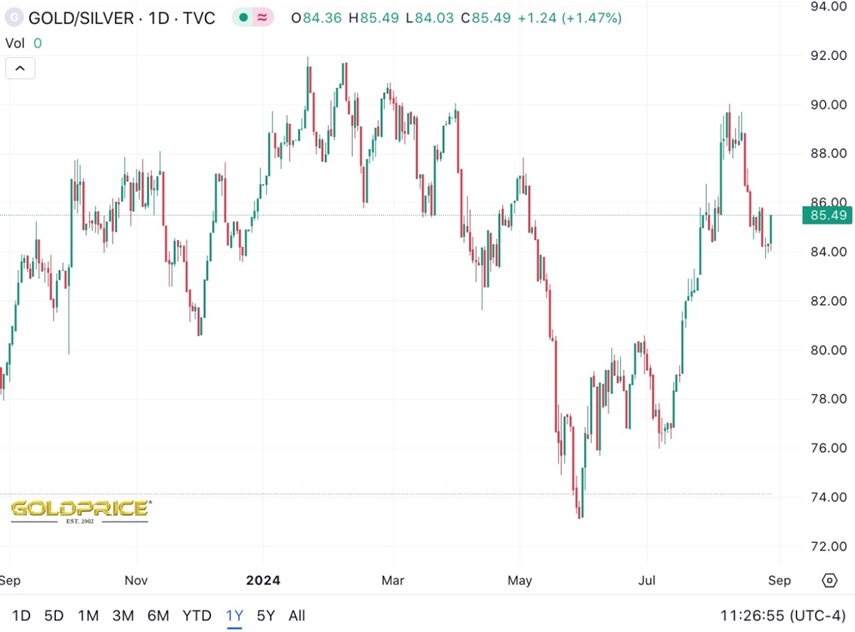
Source: Goldprice.org
According to Sprott Money, a breakout is coming because silver cannot continue to be so undervalued compared to gold. Using a median gold-silver ratio of 80:1 (80 ounces of silver to buy one ounce of gold), a gold price of $2,300 implies a silver price of $28.75. If gold reaches $2,500, as it has, maintaining that same ration means $31.25 silver.
But the thing is, when silver breaks out later this year or next, it will receive the same rush of attention and speculator cash that gold is currently enjoying. As such, the price target will not simply be $29 or $31. Instead, the initial goal will be $35 or higher. That’s a greater than 50% move from here and one from which you could greatly profit if you get correctly positioned before it begins.
According to Investopedia, during the 20th century the average gold-silver ratio was 47:1. In the 21st century, the ratio has ranged mainly between 50:1 and 70:1, breaking above that point in 2018 with a peak of 104.98:1 in 2020. The lowest level for the ratio was 35:1 in 2011.
Another way of saying this, is it currently takes 85 ounces of silver to buy one ounce of gold, compared to the 20-year average of 68 oz.
Remember, when precious metals rallied in 2020, on the back of lockdowns, interest rates slashed to zero, QE, and general market fear, silver’s gain was double that of gold. The price ran up 43% from January to December, 2020, compared to gold’s mere 20.8% rise. Earlier in the year, as gold punched above $2,000 an ounce, a 39% gain, silver rallied to nearly $30 an ounce, a 147% increase.
Meanwhile, the gold-silver ratio fell from over 100:1 to just over 64:1. It could easily happen again, especially with the Fed poised to drop rates.
Technical analysis
We can also turn to the technical analysts to determine where silver is at and where it might be heading.
Hubert Moolan notes that over the last 125 years, the silver chart has formed two remarkably similar patterns. The 49-year pattern from 1919 to 1968 is almost the same as the one that started circa 1980.
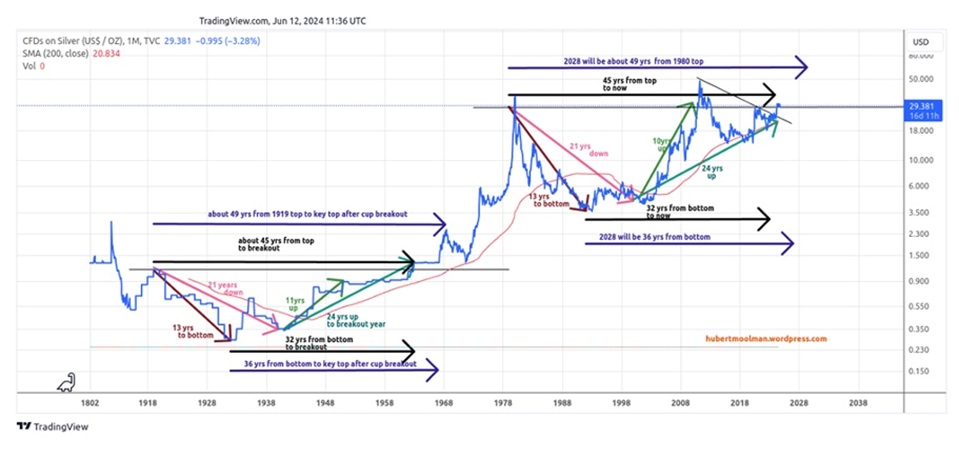
Although the patterns are similar in basic form (they are both cups) and time, there is a big difference when it comes to the magnitude of price movement. For example, the price movement from the bottom (1932) of the first pattern to the top (1951) after about 11 years (from the secondary bottom) was 3.18 fold, whereas the movement from the bottom (1992) of the second pattern to the top (2011) after about 10 years (from the secondary bottom) was 13.09 fold.
This proves there was already significant outperformance (about 4.12 (13.09/3.18) times) during the formation of the current pattern. If this outperformance continues (which it likely will), then we can expect massive silver rallies for the rest of this decade.
In May, commodities analysts at TD Securities reiterated their bullish outlook for silver as demand continues to outstrip supply (more on that below).
“The last time silver prices broke through $30/oz, it traded to $50/oz in less than ten weeks,” Daniel Ghali, senior commodity strategist at TD wrote.
The Canadian bank said that growing demand could wipe out silver’s above-ground stocks within one to two years.
Silver demand
Silver, like gold, is a precious metal that offers investors protection during times of economic and political uncertainty.
However, much of silver’s value is derived from its industrial demand. It’s estimated around 60% of silver is utilized in industrial applications, like solar and electronics, leaving only 40% for investing.
The lustrous metal has a multitude of industrial applications. This includes solar power, the automotive industry, brazing and soldering, 5G, and printed and flexible electronics.
Schiff Gold reported in May that silver demand in three sectors is expected to double in the next decade: industrial applications, jewelry production and silverware fabrication.
A report by Oxford Economics commissioned by the Silver Institute found that demand for these sectors is forecast to increase by 42% between 2023 and 2033.
As the metal with the highest electrical and thermal conductivity, silver is ideally suited to solar panels. A Saxo Bank report stated that “potential substitute metals cannot match silver in terms of energy output per solar panel.”
About 100 million ounces of silver are consumed per year for this purpose alone.
In May, a report by the International Energy Agency said global investment in solar PV manufacturing more than doubled last year to around $80 billion. This accounts for roughly 40% of global investment in clean-energy technology manufacturing.
Much of the growth is coming from, no surprise, China. The IEA says China more than doubled its investment in solar PV manufacturing between 2022 and 2023.
This is only going to continue.
According to Sprott, demand for silver from the makers of solar panels, particularly those in China, is forecast to increase by almost 170% by 2030, to about 273 million ounces — one fifth of total silver demand.
Last year the country commissioned as much solar as the entire world did in 2022. The IEA expects China to maintain an 85-90% market share of global solar supply chains and to double its manufacturing capacity again by the end of this year.
Miners are hoping to capitalize on the increasing demand for silver. Coeur Mining recently completed an expansion of its Rochester mine in Nevada, which is set to become the largest source of US-mined silver.
Hochschild Mining is also looking to expand its silver operations, by securing permits for a silver project in Peru slated to start in 2027.
Increasing investor interest in silver is hiking the share prices of some of the major silver miners. Pan American Silver is up 27.5% year to date, Coeur Mining has nearly doubled from $3.20 to $6.09, and Hecla Mining has risen from $4.69 to $5.99, a gain of 27%.
The Global X Silver Miners ETF (SIL) so far this year is up 15.1%.
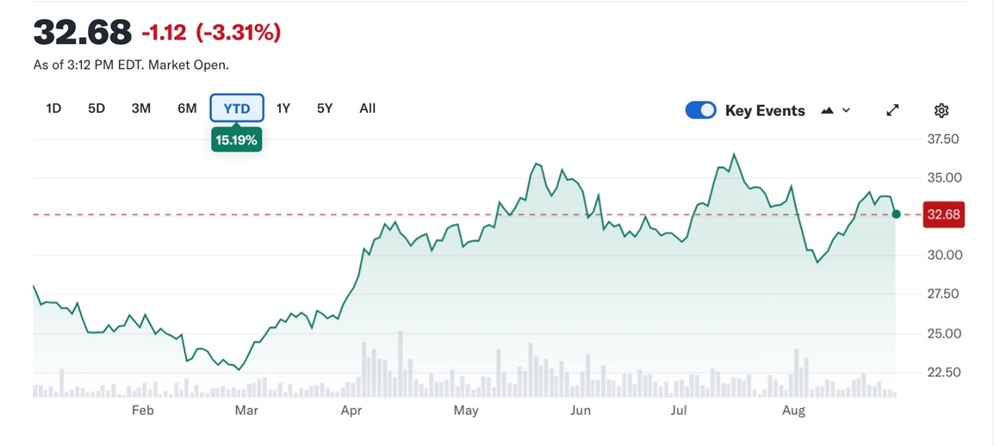
Source: Yahoo Finance
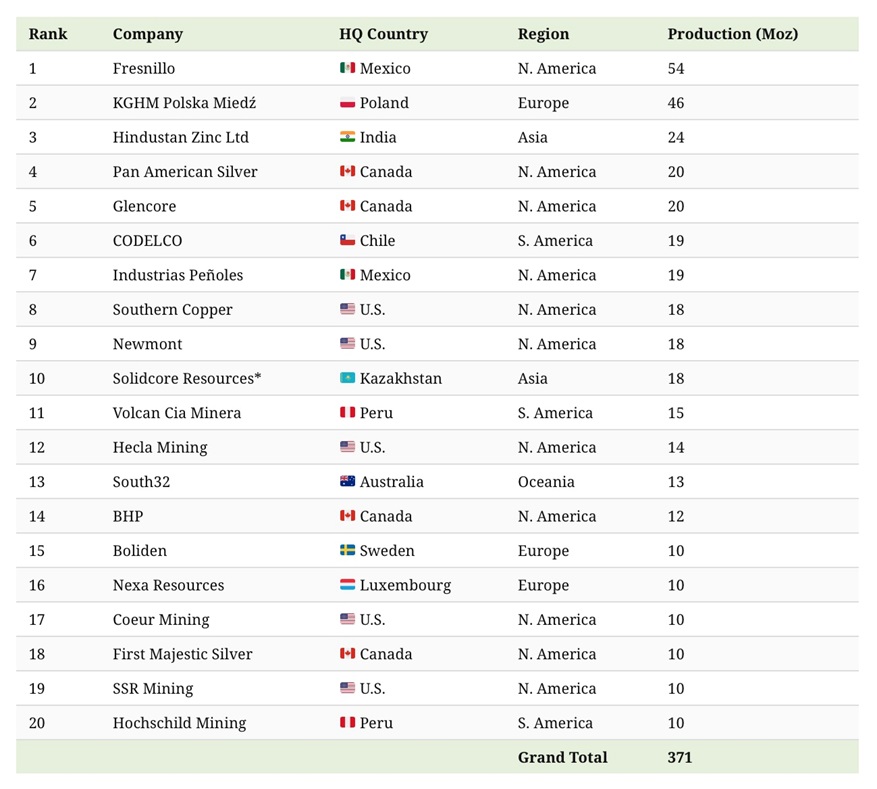
Top silver companies in 2023. Source: Visual Capitalist
The transition to an electrified economy doesn’t happen without copper and silver, which is why in my opinion they are among the most highly investable commodities now, and for the foreseeable future. The danger, for end users, and opportunity, for resource investors, of coming shortages for both metals, only strengthens my thesis.
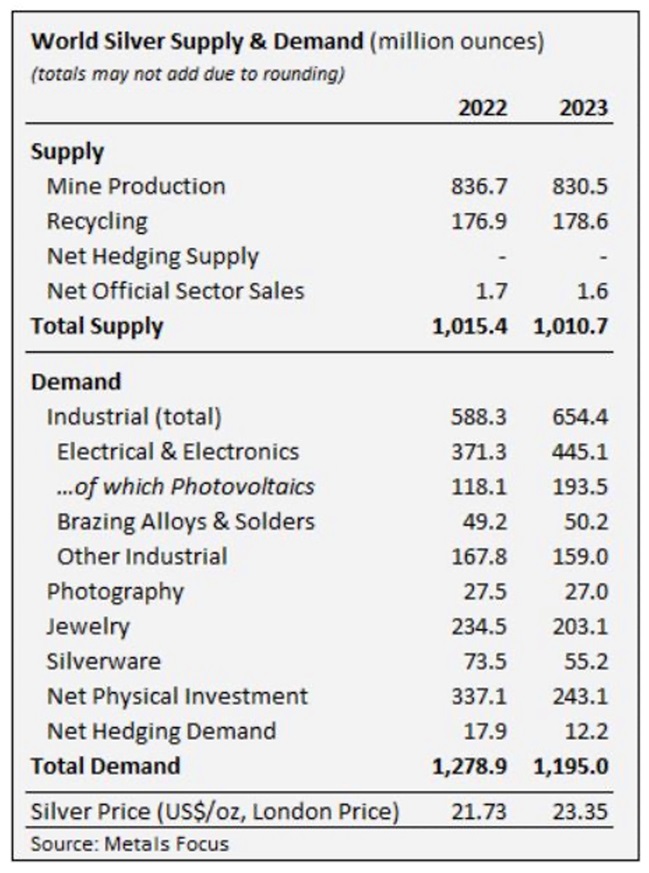
In a recent commentary, the Silver Institute said industrial demand rose 11% last year to a new record of 654.4Moz, smashing the old record set in 2022.
In fact demand exceeded supply for the third year in a row.
Higher-than-expected photovoltaic (PV) capacity additions and faster adoption of new-generation solar cells raised electrical & electronics demand by a substantial 20%, to 445.1Moz, the institute said:
This gain reflects silver’s essential and growing use in PV, which recorded a new high of 193.5 Moz last year, increasing by a massive 64 percent over 2022’s figure of 118.1 Moz. Underpinning these overall gains was the limited scale of thrifting and substitution, as silver remains irreplaceable in many applications.
Chinese silver industrial demand rose by a remarkable 44% to 261.2Moz, primarily due to growth for green applications, chiefly PV. Last year, China’s rapid expansion of PV production accounted for over 90% of global panel shipments. Industrial demand in the United States stood at 128.1Moz, essentially flat over 2022, while Japan’s industrial offtake was also basically unchanged at 98Moz.
FX Street quotes a research paper by the University of New South Wales that found “solar manufacturers will likely require over 20% of the current annual silver supply by 2027. By 2050, solar panel production will use approximately 85–98% of the current global silver reserves.”
Who’s buying all the silver? India, China and silver-backed ETFs.
India in February purchased a whack of silver bullion, with silver imports surging 260%. The country bought 2,295 tonnes compared to just 637t in January — a new monthly record.
Putting that into perspective, it’s about 70 million ounces, more silver than the US Mint produced in American Silver Eagle coins over the past three years combined.
ABC News quoted a Canaccord senior mining analyst saying that silver is a more obtainable precious metal for “mum and dad” investors than more expensive gold, especially during uncertain times.
“The Chinese consumer loves silver as well [and] that’s been another impact,” said Tim Hoff.
The role of silver in Chinese history — Richard Mills
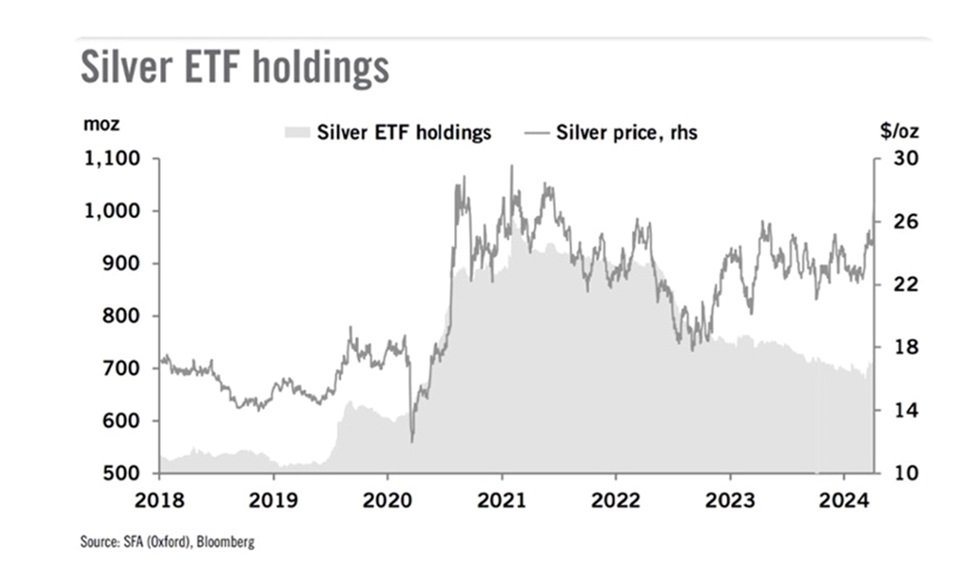
Kitco reported on April 8 that silver appears to be benefiting from both investment and industrial demand. Many investors are choosing to ride silver in an ETF investment vehicle. Kitco quoted precious metals analysts at Heraeus saying,
“Silver is a higher beta commodity than gold, so if retail investors show more interest as ETF holdings rise then it could outperform gold,” they noted. “Additionally, and in contrast to the gold market, silver investors re-entered the market for ETFs, with 10.7 moz of inflows in the last fortnight, taking total silver ETF holdings 3% higher year-to-date at 724 moz.”
The analysts said that industrial demand for silver is also expected to rise this year, based on “recent strong manufacturing data from the US and China” in addition to burgeoning Chinese solar installations.
If the demand for silver in solar power doesn’t blow the doors off the silver price in the near future, it may be a change in battery technology that does it.
Kitco reported recently that Samsung has developed a new solid-state battery that includes silver as a key component.
The site quotes retired investment professional Kevin Bambrough saying:
“The key drivers that will ramp up demand for EVs are range, charge time, battery life and safety,” Bambrough said. “Samsung’s new solid-state battery technology, incorporating a silver-carbon (Ag-C) composite layer for the anode, exemplifies this advancement. Silver’s exceptional electrical conductivity and stability are leveraged to enhance battery performance and durability, achieving amazing benchmarks like a 600-mile range and a 20-year lifespan and 9-minute charge.”
Bambrough provided estimates showing there could be up to 5 grams of silver per cell in these batteries, meaning “a typical EV battery pack containing around 200 cells for a 100 kWh capacity could require about 1 kg of silver per vehicle.”
If his numbers are right, it could mean a major new demand driver for silver going forward. Even if 20% of electric vehicles were to adopt Samsung’s SS batteries, the annual demand for silver would be around 16,000 tonnes, against total current production of 25,000 tonnes.
Kitco cites a report that says Samsung is already working with big automakers to incorporate its SS battery technology into EV development, including an agreement with Toyota to begin mass production of SS batteries in 2027. Lexus vehicles are also scheduled to be among the first to adopt them.
(The challenge is the cost. It’s around 3-4 times more expensive to manufacture SS batteries compared to lithium-ion and lithium-iron-phosphate batteries — not exactly a route to making EV sticker prices lower for cash-strapped and skeptical car buyers — Rick)
Silver supply
On the supply side, global silver mine production fell by 1% to 830.5Moz in 2023. Output was constrained by a four-month suspension of operations at Newmont’s Penasquito mine in Mexico due to a strike; lower ore grades; and mine closures in Argentina, Australia and Russia.
However, the negative supply news is countered by more silver miners listing on the Australian stock exchange, and some mothballed silver assets that are being re-envisioned as new mine startups.
For example, ABC News reports Horizon Minerals has an idle deposit near Kalgoorlie, 600 km east of Perth. “[W]e’re certainly reviewing what we’re going to do with it… and we reckon the potential is good,” said non-executive chairman Ashok Parekh.
Andean Silver recently bought a mine in Chile and is working to bring the project out of care and maintenance this year.
The article goes on to say that Australia has the largest share of the world’s economic silver resources, mostly in Queensland, the Northern Territory and South Australia. Silver is part of the commodity mix for several mines across the country.
China’s silver squeeze
The Jerusalem Post recently reported on an altogether unsurprising trend: that China is hoarding silver and deliberately driving up the price to drain the West’s resources.
The Shanghai Metals Exchange has seen a major surge in silver trading volume, with prices about 10% higher than those on Western exchanges.
Why would China want to drive up silver? Because silver is an input in many manufacturing processes, from electronics to solar panels. Companies will naturally pass on the higher cost of raw materials to consumers, which could lead to “a further slowdown of economic growth as China out produces the West in electronics and solar panels.”
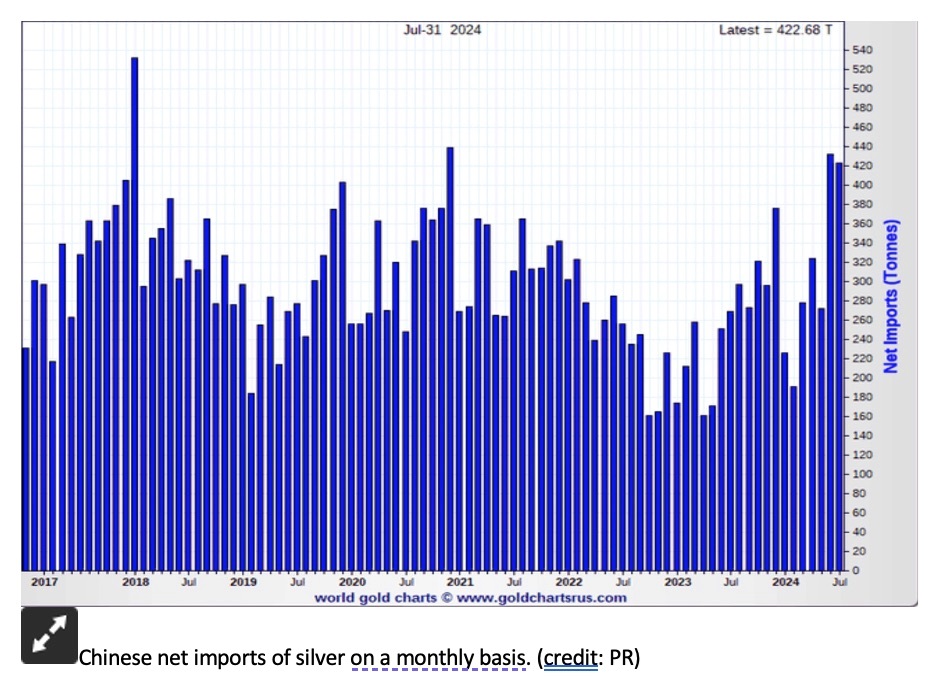
Bloomberg reports that China’s silver imports reached a three-year high of 390 tons in December and 340 tons in April, compared to the monthly five-year average of 310 tons. In June and July, net silver imports surpassed 400 tons.
China is also hoarding solar panels, likely preparing to oversaturate the US market.
“Reports have shown China has produced so many solar panels that some Chinese citizens have put them to use as garden fences. About 80% of all panels made in the world originate from China,” states the Jerusalem Post.
Meanwhile, as mentioned, India is buying silver importing significant quantities from the West in recent years. The country recently cut it import duty on silver, further increasing demand for it.
According to the Jerusalem Post, Analysts warn that the growing demand for silver, coupled with limited supply, could lead to a “silver squeeze” similar to the silver squeeze of 1980. If investors begin to panic and rush to buy silver, the price could skyrocket, causing significant disruptions to the global economy.
Silver deficit
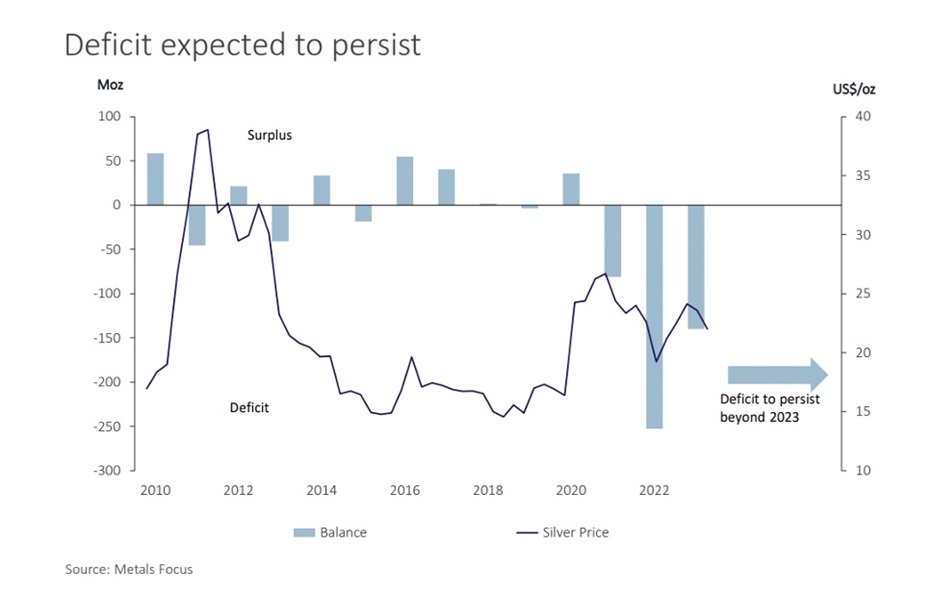
The Silver Institute reported a 184.3 million-ounce deficit in 2023 on the back of robust industrial demand.
The Silver Institute expects demand to grow by 2% this year, led by an anticipated 20% gain in the PV market. Industrial fabrication should post another all-time high, rising by 9%. Demand for jewelry and silverware fabrication are predicted to rise by 4% and 7%, respectively.
Total silver supply should decrease by 1%, meaning 2024 should see another deficit, amounting to 215.3Moz, the second-largest in more than 20 years.
In fact it’s the fourth year in a row that the silver market is in a structural supply deficit.
The numbers can be misleading.
The deficit actually fell 30% last year but at 184.3 million ounces it’s still massive. Global supply has been broadly steady at around 1 billion ounces but last year industrial silver demand grew 11%, reaching a new record of 654.4 million ounces. Usage was mostly in the green economy sector.
Total silver demand was 1.195 million ounces compared to 1,010.7Moz of total supply, which included mine production of 830.5Moz (-1%) and recycling of 178.6Moz.
A few more interesting facts from the report and observations on the silver market, courtesy of Investing Haven:
- Only 123 million oz was left for silver investors after accounting for non-investment demand. The reality is that the pool available for investors is a fraction of the total silver produced.
- The industrial fabrication of silver is expected to continue growing, driven by the PV market and other industrial segments, contributing to a forecasted 2% increase in total silver demand for the upcoming year.
- The forecasted global silver demand for 2024 is an impressive 1.2 billion ounces, potentially the second-highest level ever recorded. This growth is primarily driven by strong industrial demand.
- The COMEX silver price setting persists. Many tend to call this the “silver price manipulation by commercials.” Amid such short to medium term-oriented price influences, there is a deepening physical shortage unfolding. The clock is ticking, and the silver market is at a crucial juncture. The Silver Institute’s bullish data adds weight to the argument that higher silver prices are not a matter of “if” but “when”.
- The dynamics of price are completely distorted. It is clearly not supply/demand that is determining price, but something else. This “something else” is futures trading, because it is futures market positioning that is clearly determining price more than supply/demand dynamics. This is what many tend to call “silver price manipulation”, i.e. the dynamics of positioning between commercials and managed money traders. Sooner or later, the dynamics in the physical market, driven by a supply shortage that is getting out of hand, will ensure that the price of silver will reflect the supply shortage.
Conclusion
Silver is undervalued as reflected by the current gold-silver ratio which sits at 86:1. The 20-year average is 68:1. Even though silver has outperformed gold year to date, by 28% to 23%, it still has a lot more room to run.
A May note from Citigroup, via Bloomberg, says if the Federal Reserve proceeds with interest-rate cuts and economic growth stays strong in the second half, the ratio could move to around 70, implying a strong move up.
At Singapore-based dealer Silver Bullion Pte, more clients are buying physical silver and waiting to see what the ratio does.
Amongst the trading and the strategizing, we can’t forget simple supply and demand. Silver is in the fourth year of a shortage, with mined supply seemingly unable to keep up with demand, which is strongly influenced by the solar and electronics markets.
We’ve warned of a silver supply crunch coming, partially caused by China, which is hoarding the metal and driving up the price, in an effort to hurt Western manufacturers. As the price of gold tracks higher Indians are increasingly buying massive amounts of silver.
Bloomberg reported over the next two years, the LBMA stockpiles may be depleted given the current pace of demand, according to TD Securities.
“We are slowly going to see supplies tightening because industrial demand is set to go higher,” said Gregor Gregersen, founder of Silver Bullion Pte. “If investors are also starting to buy, then I think in two or three months’ time, my biggest problem might end up being ‘Where do I find supply?’ rather than ‘How do I sell the silver?’”
Richard (Rick) Mills
aheadoftheherd.com
subscribe to my free newsletter
********
share
share
share
share
share
More from Silver Phoenix 500