Silver Price Forecast: $47 - $50 Silver by Q3 2024
 A once-per-four-year signal says silver is about to rapidly surge higher within the coming months, and should achieve a price target of $47 - $50 per ounce by the end of the third quarter 2024. Get ready!
While the Federal Reserve meets today and prices could be volatile following the interest rate decision, our pending surge signal is already in the books as of mid-May.
Wise investors should be finalizing their silver-related portfolios NOW, as the next wave of the advance should begin any week now.
Gold to Silver Ratio Breaks Down
What is this once-per-four-year signal?
It is an impulsive breakdown from a multi-year rising trend in the gold to silver ratio.
What is the gold to silver ratio?
It is the number of ounces of silver required to purchase one ounce of gold. And generally speaking, when the ratio moves lower, it represents periods of rapid outperformance by silver relative to gold.
Below we show the multi-year breakdown in the gold to silver ratio which has just registered as of mid-May:
History of the Signal
Why is it so important to pay attention to multi-year breakdowns in the gold to silver ratio?
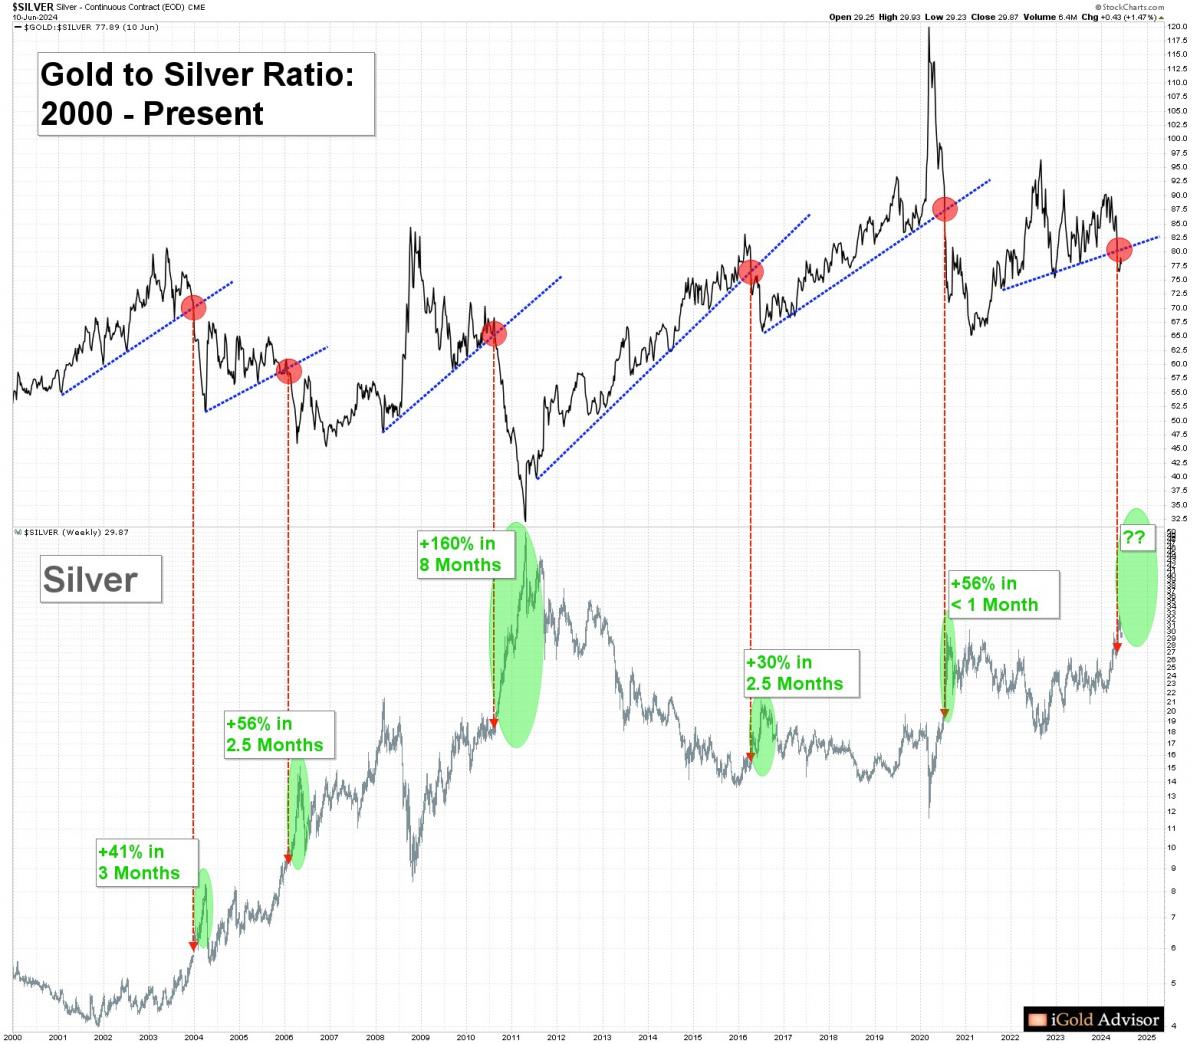
For a proper understanding of the signal, we study the history of the ratio. Below is the gold to silver ratio from 2000 to present:
As we can see, breakdowns from multi-year rising trends (red callouts on blue lines) have occurred only five times in the previous two decades:
- In late-December 2003, the gold to silver ratio broke decisively lower through a rising trend which began in 2001 à the result was that silver surged higher by 41%, from under $6 per ounce to nearly $8.50, in only three months.
- Then in February 2006, the ratio broke lower again through a rising trend which began in April 2004 à the result was that silver advanced by over 56%, from under $10 to over $15 per ounce, in just two and a half months.
- In August 2010, the ratio again broke lower through a rising trend which began in March of 2008 à the result was that silver surged by an incredible 160%, from under $19 to nearly $50 per ounce, in approximately eight months.
- Then in April 2016, the ratio again broke lower through a rising trend which began in 2011 à the result was that silver surged by 30%, rising from $16 to over $21, in just two and a half months.
- Finally in 2020, the ratio broke lower through another multi-year rising trend which began in 2016 à the result is that silver rose an incredible 56%, rising from $19 to nearly $30 per ounce, in less than one month.
In sum:
- There have been five multi-year breakdown signals in the gold to silver ratio over the past 20 years.
- The average silver advance of these five signals has been +69% in an average of just 3.4 months.
- In other words, silver tends to grind in a range for several years at a time. But then when it advances, it does so rapidly in a relatively short period of time.
Silver’s Price Target
Just the sixth gold to silver ratio breakdown signal of the last quarter century has now appeared on the charts!!
The ratio broke down in mid-May, when silver was trading at $28.42 per ounce.
If we take the average of the previous five signals (+69% advance), and add this onto the $28.42 price, we yield an estimated target of $47.92 per ounce.
What about the timing for the move?
The average of the previous five signals resulted in a time to target of 3.4 months.
If we take 3.4 months and add it onto the ratio breakdown point of mid-May, we arrive at a target date of late-August through early-September 2024.
Takeaway on Silver
There it is: $47.92 per ounce by the end of Q3 2024 is our projected target for silver.
[And by the way, this figure is close enough to the $50 per ounce previous all-time highs from 1980 and 2011 that we can logically consider this a $47 - $50 target zone for the advance ahead.]
The historical data speaks for itself. This is only the sixth time in the past quarter century that this signal has appeared.
Throughout history, silver tends to lag gold for many years, and then play catch-up rapidly and in a greater percentage gain in relative terms. The charts suggest to us that one of those periods has arrived now.
Wise investors will be finalizing their silver-related portfolios immediately, as this move could start any day now.
At www.iGoldAdvisor.com, we are preparing to buy shares in silver mining companies which will offer leverage to the gains in the underlying silver bullion price. In Precious Metals Intelligence+, we publish the research of the exact mining companies we are investing in, for investors who would like to follow along with our decisions.
In addition, for higher net-worth investors we offer a service called Elite Private Placements. This service allows investors to receive FREE warrants in addition to their shares in the silver mining companies, which results in even greater upside potential as compared to buying these same companies in the open market. Our last private placement before silver begins its next leg higher should be available within the coming 2 – 3 weeks.
iGold Advisor is a 100% independent research and analysis firm and takes no fees nor kickbacks from any companies featured in our research. We are solely dedicated to helping individual investors navigate the precious metals markets.
********


