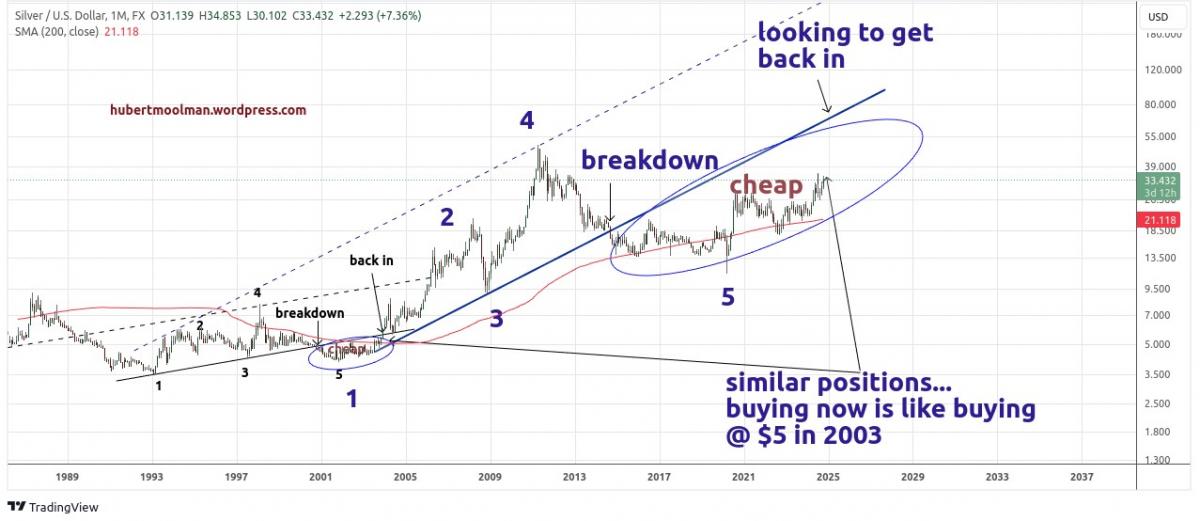
At These Levels, Buying Silver Is Like Getting It At $5 In 2003.
The current setup on the silver chart is a lot like the start of the silver bull market of the early 2000s. In those days silver was under $5 and considered cheap.
The current bottoming pattern from around 2014 to now is very similar to the early 2000s bottoming pattern (see the chart below).
I have highlighted two similar patterns (marked 1 to 5).The bottoming period of the early 2000s started when silver broke down at the black support line (bottom of the channel) in late 2000 and made a low at point 5. This is similar to the period since the breakdown at the blue support line (bottom of the channel) in late 2014, eventually making a low in 2020.
I have indicated how the current chart position is similar to late 2003, when prices were still around $5. Late 2003 was still very early in the bull market, an excellent time to buy. Buying at the current levels presents equally great value, given the significant inflation since 2003.
This is especially true given that silver prices is expected to catch up with the significant debt inflation, as explained here.
Price will probably soon move back inside the channel just like it did in December 2003 and stay above that blue line for the rest of the bull market.
So while the silver price is still well below that blue line, it is really cheap.
Get more of this kind of analysis at my premium gold and silver blog or my Silver Long-term Fractal Analysis Report.
Warm regards
Hubert Moolman
And that, knowing the time, that now it is high time to awake out of sleep: for now is our salvation nearer than when we believed.
******


