Precious Metals Silver, Gold, Gold Miner Stocks on the Rise?
The past couple months investors have been focusing on the equities market. And rightly so with stocks running higher and higher. Unfortunately most money managers and hedge funds are under performing or negative for the first quarter simply because of the way prices have advanced. New money has not been able to get involved unless some serious trading rules have been bent/broken (buying into an overbought market and chasing prices higher). This type of market is when aggressive/novice traders make a killing cause they cannot do anything wrong, but 9 times out of 10 that money is given back once the market starts trading sideways or reverses.
While everyone is currently focusing on stocks, its important to research areas of the market which are out of favor. The sector I like at the moment is precious metals. Gold and silver have been under pressure for several months falling out of the spot light which they once held for so long. After reviewing the charts it looks as though gold, silver and gold miner stocks are set to move higher for a few weeks or longer.
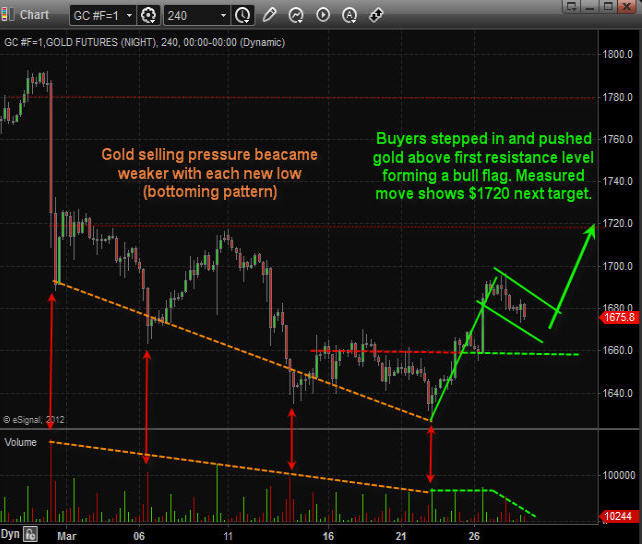
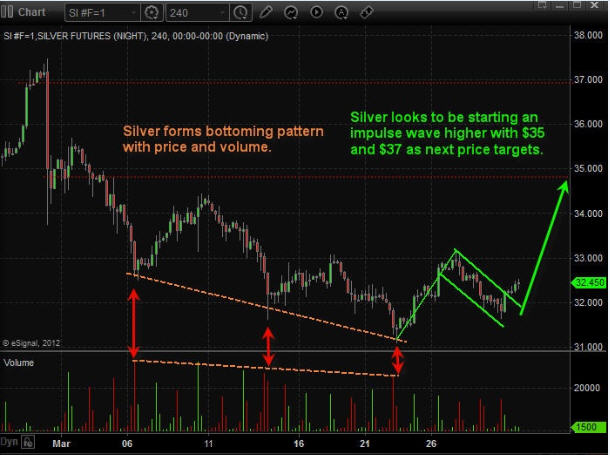
Below are the charts of gold and silver charts. Each candle stick is 4 hours allowing us to look back 1-2 months while still being able to see all the intraday price action (pivot highs, pivot lows, volume spikes and price patterns).
The 4 hour chart is one time frame most traders overlook but from my experience I find it to be the best one for spotting day trades, momentum trades and swing trades which pack a powerful and quick punch.
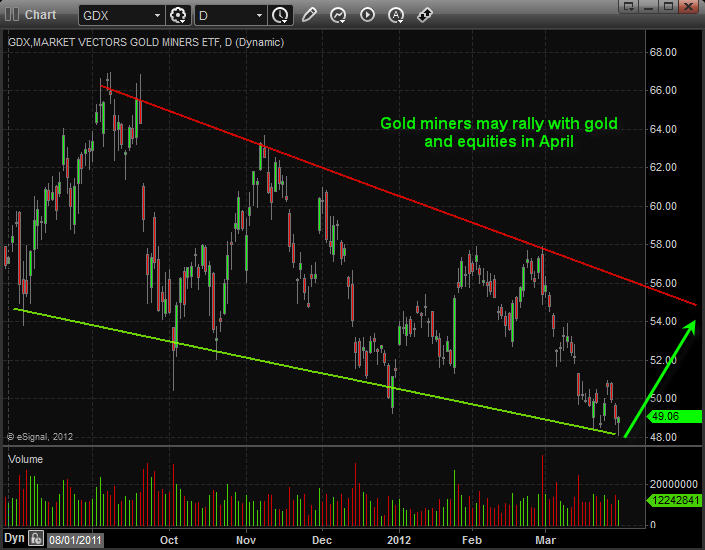
As you can see below with the annotated charts gold, silver and gold miner stocks are setting up for higher prices over the next 2-3 weeks. That being said we may see a couple days of weakness first before they start moving up again.
4 Hour Momentum Chart of Gold

4 Hour Momentum Chart of Silver

Gold miner stocks have been underperforming precious metals for over a year already. Looking at the daily chart we are starting to see signs that gold miner stocks could move up sharply at the trade down at support, oversold and with price/volume action signaling a possible bottom.

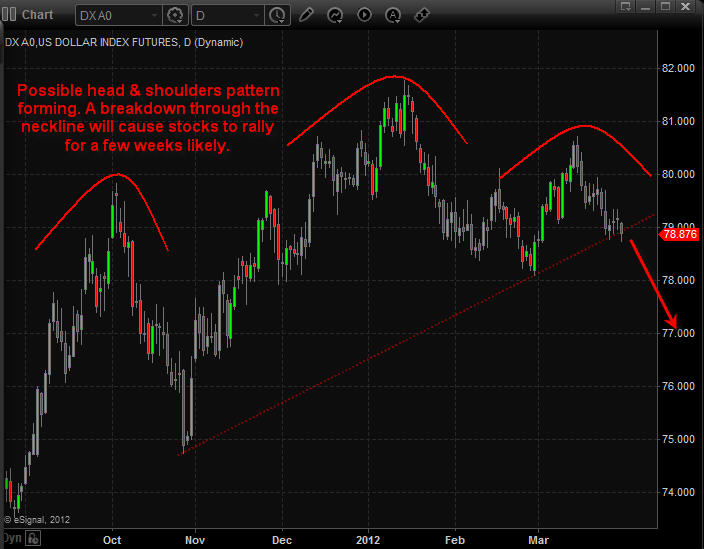
The US Dollar index has formed a possible large Head & Shoulders pattern meaning the dollar could fall sharply any day. The size of this chart pattern indicates that if the dollar breaks down below its support neckline the we should expect the dollar to fall for 2-3 weeks before finding support.
Keep in mind that a falling dollar typically means higher stock and commodity prices. If this scenario plays out then we should see the market top late April which falls in line with the saying "Sell In May and Go Away".

Precious Metals Conclusion
Looking forward 2-3 weeks precious metals seem to be setting up for higher prices as we go into earning season and May. Overall the market is close to a top so it could be a bumpy ride as the market works on forming a top in April.


