A Silver Bonanza in 2003?
I asked the question in my last silver futures report back in March, "When will this correction finally end?" I answered by pointing out that the silver chart suggested the correction should be over soon week as the latest 12-week cycle in silver was bottoming at that time along with the dominant interim 40-week cycle. Since that time silver has performed even better than expected in zooming up from its lows near $4.35 to its recent high of $4.80.

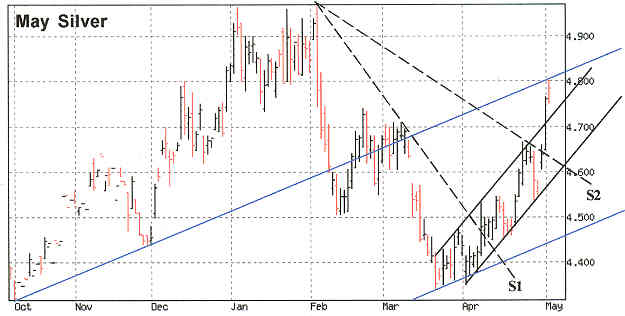
So what can be expected from silver in the month of May? More importantly, will the remainder of 2003 witness the long-awaited "silver bonanza" that silver analysts have been dreaming of for the past 5-10 years? Let's start by addressing the first question pertaining to the short-term outlook. The above silver daily chart shows a silver price somewhat over-extended in the immediate-term and starting to encounter resistance around the $4.80 area. I'd be surprised if silver made it much above $4.80 this week without pulling back first. A consolidation of 1-2 weeks also wouldn't be surprising given the recent extraordinary price performance in April. Yet it cannot be denied that silver has time and momentum factors on its side this spring.
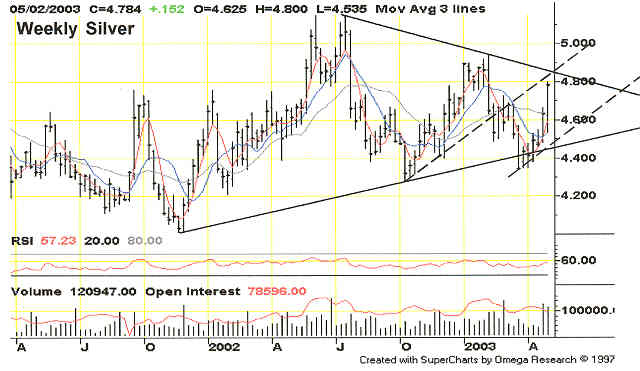
What impresses me about the daily chart shown above is that the previous dominant low made back in October 2002 produced an interim uptrend line (see rising blue line) that took prices up to the January-February 2003 highs near $5.00 before being broken in March. Once again, silver, after having bottomed off a much longer uptrend line (see weekly chart below) has risen back up to meet with the previous interim uptrend line around the $4.80 level. So you can see the resistance that silver is encountering at this important level.
Getting above $4.80 will take lots of volume and will probably take some further consolidation before it is accomplished. Also worth pointing out is that in the weekly chart (below) you can see a downtrend line from last summer's highs stretching down to the current $4.80 area, thereby strengthening the resistance that exists at this level.

In a pullback scenario, I wouldn't want to see silver decline any lower than say $4.60, where a series of trendlines and channels converge. This also represents roughly the 50% retracement level from the April rally. I am impressed with how two downward trending lines of supply in the daily chart (labeled "S1" and "S2") have been easily broken by silver, leaving just one more major line of supply that needs to be broken before a more sustained silver rally can begin. It is obvious that most of that supply exists between $4.80-$4.85. When this is fully overcome then silver will be on its way to a truly "bonanza year."


