The HUI 5:15 Train
Every baseball player knows the saying, “3 strikes and you’re out!” Well, the dollar bugs may be about to strike out, against silver bullion.
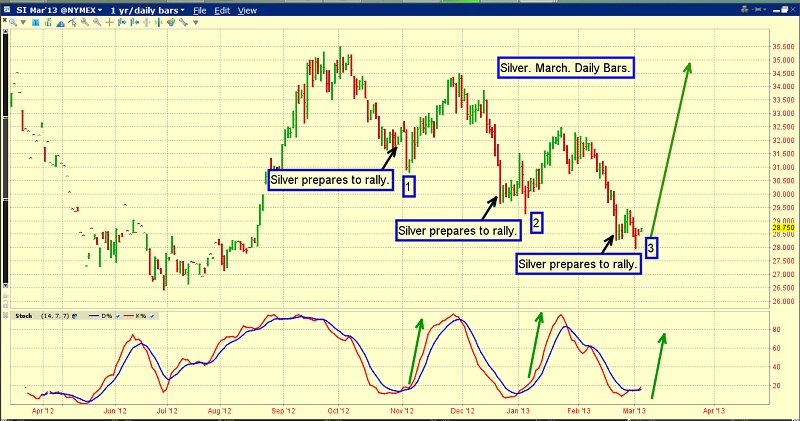
You are looking at the daily silver chart. It’s almost eerie how similar each of the three highlighted trough areas are to each other.
In the first two examples, silver made a “capitulation low”, and that was followed by a final lower low, which looks like a spike.
The same set-up is in play now. Of additional interest, is the fact that the silver market now shows three corrective phases, since topping in October.
Some analysts believe that all market cycles consist of three waves in one direction, and then three waves in another direction. I’m a market agnostic in that respect, but it’s still good news for silver bulls.
It’s quite possible that the next rally will be of “intermediate trend quality”, rather than just a minor uptrend that ends quickly.
Whether you are a short term trader, or a long term investor, my suggestion is to book profit on quite a few short positions in this general price and time area, and add to long positions.
Market turning points are usually more of a process than an event; oscillators begin crossing over, the news becomes very bearish, and buyers disappear.
The silver market has a “feel” to it now that is solid. Gold feels more volatile than silver does. Maybe you have that feeling, too. I hope so.
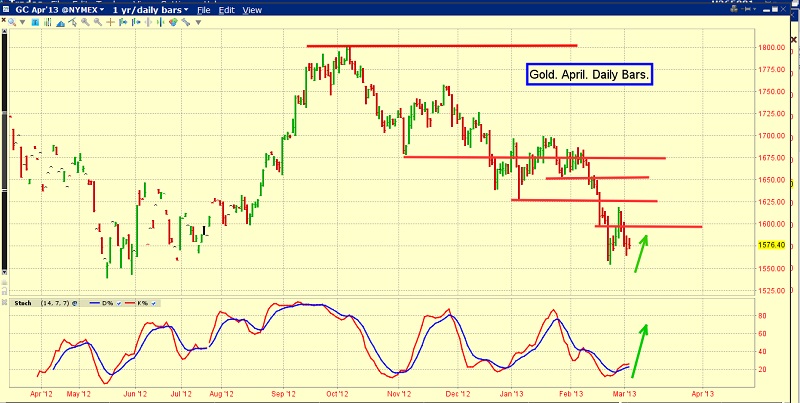
That’s the daily gold chart. My 14,7,7 series “stokeillator” has given a buy signal, but the crossover looks like a bit of a wet noodle event.
There has probably been a fair bit of forced liquidation of leveraged hedge fund gold positions, and that’s likely what is responsible for the droopy look of my stokeillator.
Gold investors seem nervous, and that’s the kind of sentiment that allows the price to climb higher. There is a small double bottom pattern in play now.
If I had to buy just one metal now, I would choose silver, but all investors should own more gold than silver, in a super-crisis.
While gold and silver look “ok” here, life for investors trapped in the gold stocks gulag has become all-horrific.
It feels like gold stocks are experiencing their own 1930s style depression, and that’s likely because of forced liquidation of enormous hedge fund positions.
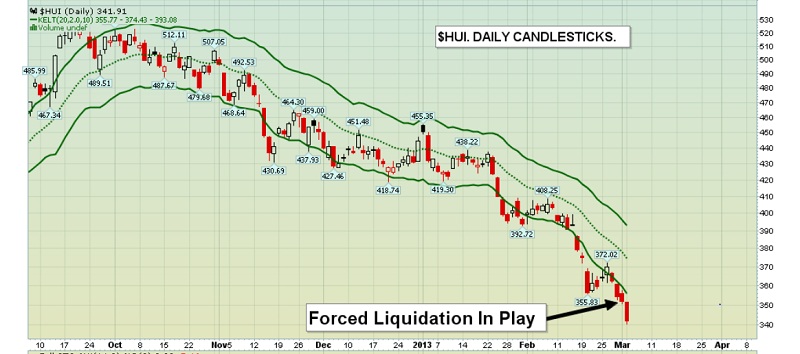
That’s the daily chart of the HUI gold bugs index. The price is in a downtrend below the lower keltner line, which is often a sign of forced liquidation. The greatest leverage you can use in this crisis is: no leverage. Debt is leverage, and most of it is being destroyed. Those who think, “my leverage involves gold and gold stocks, so I’ll be ok”, are probably learning a hard lesson about leverage.
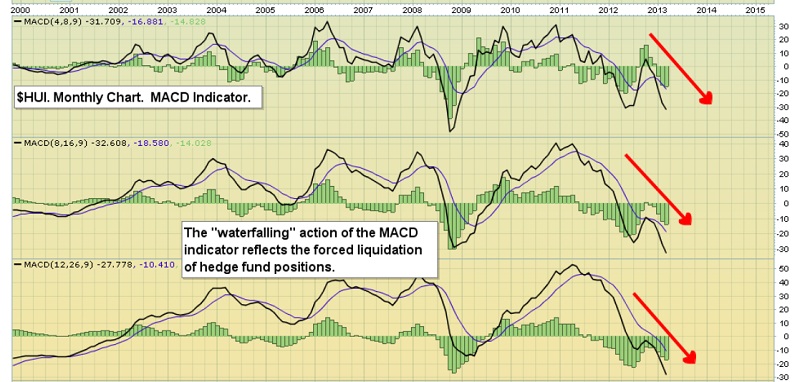
You are looking at the monthly chart of the HUI, showing just my three series of the MACD indicator. That’s what’s known as “water-falling” action. Only the funds holding the leveraged gold stock positions know how much they are being forced to sell. It ends when it ends.
There has also been a “death cross” event in many gold-related items. That’s when the 50 day moving average crosses the 200dma, on the downside.
Generally speaking, I think the death cross is a useless tool, for all practical intents and purposes, in the market. It’s too slow, and it can produces sell signals when investors should be buying.
So, what moving average signals are reliable, for investors who want to make large returns and avoid scary price drops? Well, to find out, please click the following link: THE WHO – 5:15.
All joking aside, I use the 5 month and the 15 month moving averages, to identify what may be potentially substantial intermediate trend moves.
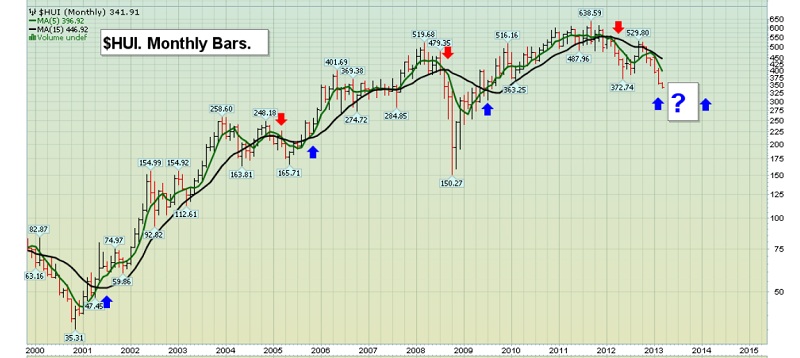
On the monthly chart of the HUI, use of my 5:15 moving average series has paid off in spades, for those who follow the signals.
There have been three great bull runs, and 3 nasty corrections, including the current one. Moving average fans should wait for the HUI “5:15 train” to produce a crossover signal, and then place your buy orders.
It’s too late to sell gold stocks now. I’m covering my leveraged gold stock short positions here, and adding light fresh longs. If the 5:15 train crosses the tracks, from bear to bull, I’ll be the first to call, “All aboard!”
Special Offer For Gold-Eagle Readers: Send me an email to freereports4@gracelandupdates.com and I'll send you my free "Understanding The Death Cross" report. Learn how to apply Fibonacci lines to gold, silver, oil, and the Dow. I'll show you how to determine which lines may be more important than others, right now!
Stewart Thomson
Graceland Updates
www.gracelandupdates.com
Email: stewart@gracelandupdates.com
Mail to:
Stewart Thomson
1276 Lakeview Drive
Oakville, Ontario L6H 2M8 Canada
Risks, Disclaimers, Legal
Stewart Thomson is no longer an investment advisor. The information provided by Stewart and Graceland Updates is for general information purposes only. Before taking any action on any investment, it is imperative that you consult with multiple properly licensed, experienced and qualifed investment advisors and get numerous opinions before taking any action. Your minimum risk on any investment in the world is: 100% loss of all your money. You may be taking or preparing to take leveraged positions in investments and not know it, exposing yourself to unlimited risks. This is highly concerning if you are an investor in any derivatives products. There is an approx $700 trillion OTC Derivatives Iceberg with a tiny portion written off officially. The bottom line:
Are You Prepared?


 Stewart Thomson is president of Graceland Investment Management (Cayman) Ltd. Stewart was a very good English literature student, which helped him develop a unique way of communicating his investment ideas. He developed the “PGEN”, which is a unique capital allocation program. It is designed to allow investors of any size to mimic the action of the banks. Stewart owns GU Trader, which is a unique gold futures/ETF trading service, which closes out all trades by 5pm each day. High net worth individuals around the world follow Stewart on a daily basis. Website:
