Have Gold & Silver Stopped Responding To Dollar's Price Action?
Gold cannot be printed or manufactured in contrast to the currency. That’s why over the long term it has kept its value as the ultimate currency. There can be no “gold war.” However, we often hear about a currency war. Sounds familiar, were did we hear this before?
The phrase “currency war” was coined by Brazilian Finance Minister Guido Mantega after the financial crisis of 2008. The idea is that highly indebted nations weaken the value of their currency by cutting interest rates down to zero and printing fiat currency in order to gain trade advantages (cheaper products to export) and to pay less debt service on their bonds. Countries compete against each other to achieve a relatively low exchange rate for their own currency. The policy can trigger retaliatory action by other countries that in turn can lead to a general decline in international trade, harming all countries.
Concerns over a currency war prompted the Group of Seven and Group of 20 economies recently to formulize what constitutes appropriate behavior by central banks in influencing currency-exchange rates.
Let’s look at some numbers. Global currency reserves have swelled from $1.9 trillion in the year 2000 to a whopping $11.2 trillion by the third quarter of 2012. But most of that gain took place in the past six years with global currency reserves doubling to the current levels from $5.6 trillion at the beginning of 2007. If that is not evidence of the global currency war then what is? We can see two different aspects. The first is undeniable evidence of aggressive money printing, but we already know that. The second, is an indication of determined stockpiling of the currencies of other countries in order to weaken your own currency.
For a widespread currency war to occur a large proportion of significant economies must wish to devalue their currencies at once. This has so far only happened during a global economic downturn.
Under normal economic conditions countries tend to overlook a small rise in the value of their own currency. However, during a time of recession, nations can take umbrage at other countries’ devaluations.
Let’s begin this week's technical part with the analysis of the U.S. Dollar (charts courtesy by http://stockcharts.com).
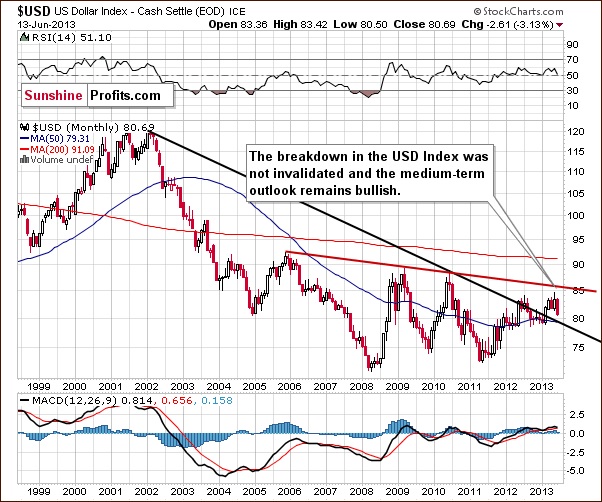
Let’s start today’s analysis of the U.S. Dollar with its long-term chart.

When we take a look at the above chart we can see that the USD Index declined once again this week. Despite that fact, the January breakout was not invalidated. As we see, the index is still above the declining support line, and thus the medium-term outlook remains bullish.
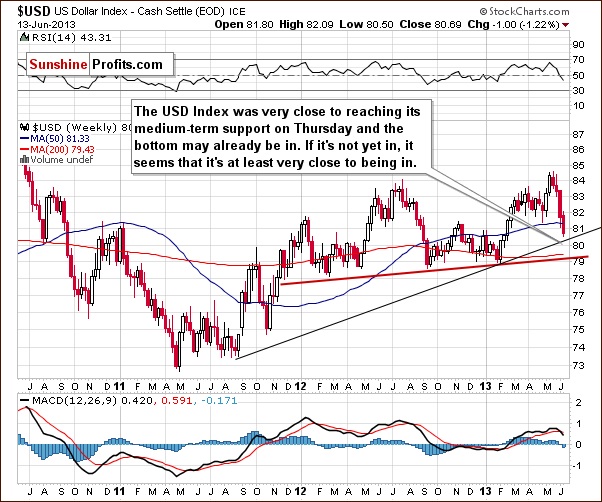
Let’s take a look at the medium-term situation. Has it changed since last week?

In this perspective we can see that the USD Index moved to its medium-term support line (marked with the thin black line), which is currently close to 80.4. It is very possible that this line will pause the decline, at least for a while, and it’s quite possible that it will actually stop it.
The situation remains bullish for the USD Index in the long and medium term, so let’s check to see if the short-time outlook is the same.

During the last several days, the USD Index declined and moved slightly below the short-term support line. There is a medium-term support line visible on the previous chart that is much more important so the above is actually not a big deal.
The most important factor on the above chart supporting the bullish case is the cyclical turning point which is very close – about a week away. It is possible that we will see its impact on the dollar next week and this can lead to a bigger pullback or – more likely – the end of the current decline. If we move back in time a bit, we will see similar situation in August and September 2012 when the cyclical turning point worked very well after a significant decline.
Additionally, please note that the RSI Indicator is now at the 30 level, which is a classic buying opportunity.
Let's find out what impact has this decline had on the two most popular precious metals.
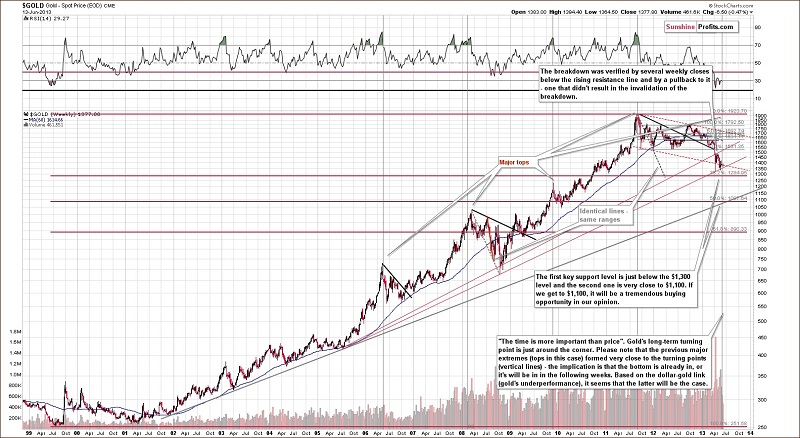
In this week’s very long-term gold chart, comments made in last week’s Premium Update remain up-to-date:
The outlook continues to be bearish and the trend remains down. Gold could still decline heavily based on the long-term cyclical turning point (…). In both 2008 and 2009, local tops formed slightly after the cyclical turning point, so it is possible that the reversal in the downtrend won’t be seen until after the cyclical turning point once again, leaving a number of days in which further declines could be seen.
We are still likely to see declines after the cyclical turning point from this long-term perspective. The turning point should work on a “near to” basis and declines will likely be seen sooner rather than later (and the bottom is likely weeks away, not months away).
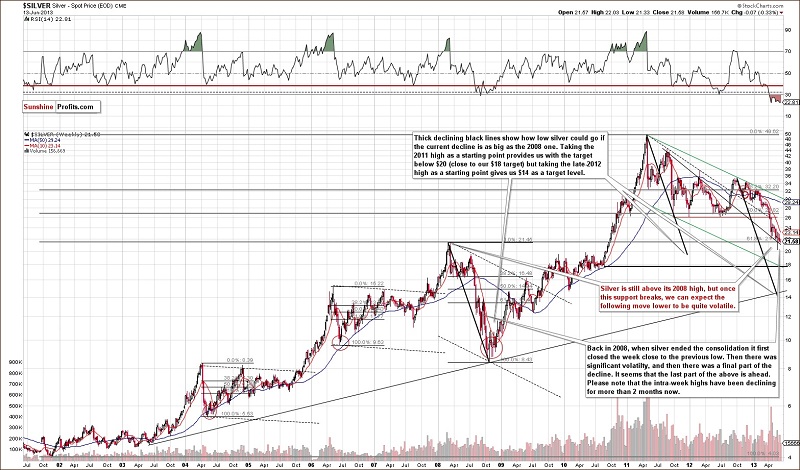
Now let’s take a look at the white metal.
In this week’s very long-term silver chart, not much really happened as prices declined slightly, less than half of 1 percent overall. The intra-day high for the week was lower than last week once again and from this perspective, the declines clearly go on.
No confirmed move has been seen below the level of the 2008 highs, but silver’s price is only slightly above it at this time. It seems that we’ll have another sharp decline once the breakdown below this support level is seen and confirmed.
Summing up, the most important event in the currency market was further decline of the dollar. Although the decline visible on the USD Index chart has been quite heavy, we have not seen a rally in gold and silver so far this week – they moved lower. Gold’s underperformance has become even more significant this week and we think that this makes the outlook even more bearish for the short term. Although recent declines in silver have been small, the downtrend remains in place. The implications of the above-mentioned underperformance are bearish for the precious metals sector.
********
To make sure that you are notified once the new features are implemented, and get immediate access to our free thoughts on the market, including information not available publicly, we urge you to sign up for our free gold investment newsletter. Sign up today and you'll also get free, 7-day access to the Premium Sections on our website, including valuable tools and charts dedicated to serious Precious Metals Investors and Traders along with our 14 best gold investment practices. It's free and you may unsubscribe at any time.
Thank you for reading. Have a great and profitable week!


