This Points To Significantly Higher Silver Prices


Since the creation of the Federal Reserve, the Dow Jones has significantly outperformed silver.
It was only during brief periods before the 1919 and 1980 silver peaks that silver was able to outperform the Dow (see the Dow/Silver chart below).
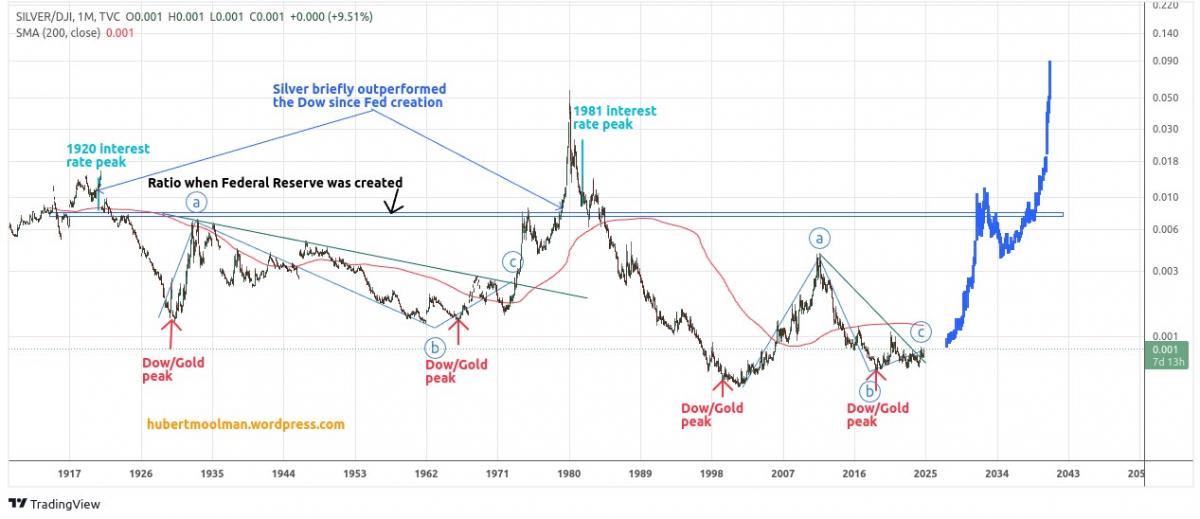
The Dow/Silver ratio needs to rise above the double blue line in order to reach parity with the Dow since the creation of the Federal Reserve. In current prices, that would mean silver's price needs to be above $340.
In the chart above, there are two similar patterns, both starting near an interest rate peak (1920 and 1981). I have marked both the patterns (a,b,c).
Both patterns appear to bottom very close to a Dow/Gold peak. This was recently pointed out as a sign of a coming multi-year silver rally. Point c was the key breakout point that occurred in 1973. If the comparison is valid, then the current pattern is also at point c.
It is also interesting that point c was close after the key debasement events shown on my silver and gold chart analysis.
It is after point c that the ratio made a move towards the double blue line (and beyond) in the 1970s. It is very likely that silver will outperform the Dow for at least the coming decade and possibly make new highs for the Dow/Silver ratio.
Learn more at my premium gold and silver blog or my Silver Long-term Fractal Analysis Report .
Warm regards
Hubert Moolman
And that, knowing the time, that now it is high time to awake out of sleep: for now is our salvation nearer than when we believed.
*******
More from Silver Phoenix 500