US Dollar Breaks 2-Month Support, S&P 500 Slide Continues
NEW YORK (Aug 10) The US Dollar and the S&P 500 continue to decline in tandem, with the stock index down for a third day as the benchmark currency broke key chart support.
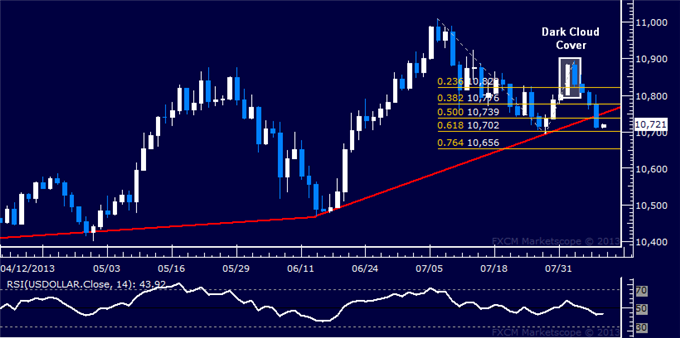
US DOLLAR TECHNICAL ANALYSIS – Prices took out support at a rising trend line set from mid-June, with sellers now aiming to challenge the 61.8% Fibonacci expansion at 10702. A break below this barrier exposes the 76.4% level at 10656. Near-term resistance is at 10739, the 50% Fib, followed by the trend line (now at 10751).