US Dollar Price Forecast: ECB Rate Decision Looms – Gold, GBP/USD, and EUR/USD Outlook
LONDON (December 12) The US Dollar remained steady after the Core CPI m/m met expectations at 0.3%, reinforcing confidence in the Federal Reserve’s data-driven approach ahead of next week’s meeting. CPI y/y rose to 2.7%, matching forecasts but signaling inflation remains above target, limiting significant moves in the dollar.
Gold prices, however, dipped slightly to $2,716.92, reflecting investor caution amid conflicting cues from lower crude oil inventories (-1.4M) and a sharp Federal Budget deficit of $366.8B.
With Core PPI m/m and unemployment claims data due on Thursday, the greenback’s trajectory and gold’s safe-haven appeal hinge on upcoming economic insights and Fed guidance.
US Dollar Index (DXY) – Technical Analysis

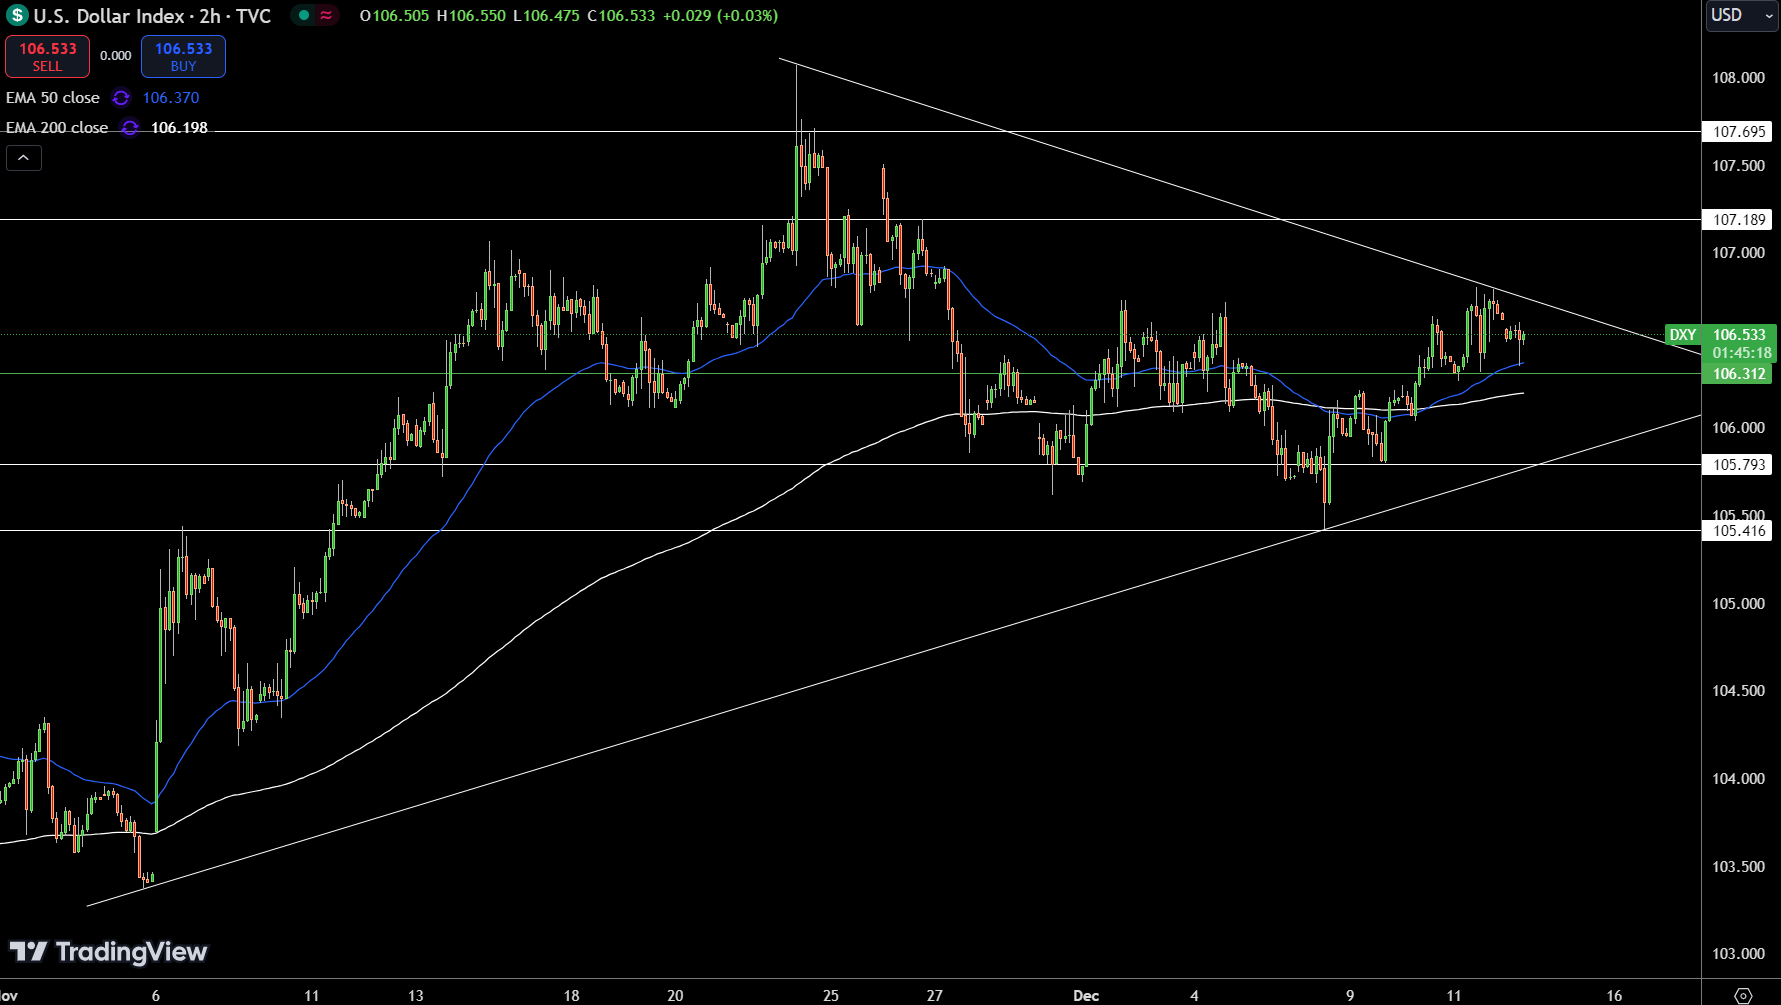
Dollar Index Price Chart – Source: Tradingview
The Dollar Index (DXY) is trading at 106.536, down 0.08%, as it faces resistance from a downward trendline near $106.500. The pivot point at $106.312 is a crucial support level to watch; staying above this level could prevent further declines. Immediate support lies at $105.793, with additional safety at $105.416.
On the upside, resistance is observed at $107.189, followed by $107.695, which may challenge bullish momentum.
The 50-day EMA at $106.370 and the 200-day EMA at $106.198 indicate short-term and long-term alignment with the current trend. A sustained break above $106.500 could signal recovery, while failure to hold $106.312 may intensify selling pressure.
Gold – Technical Analysis

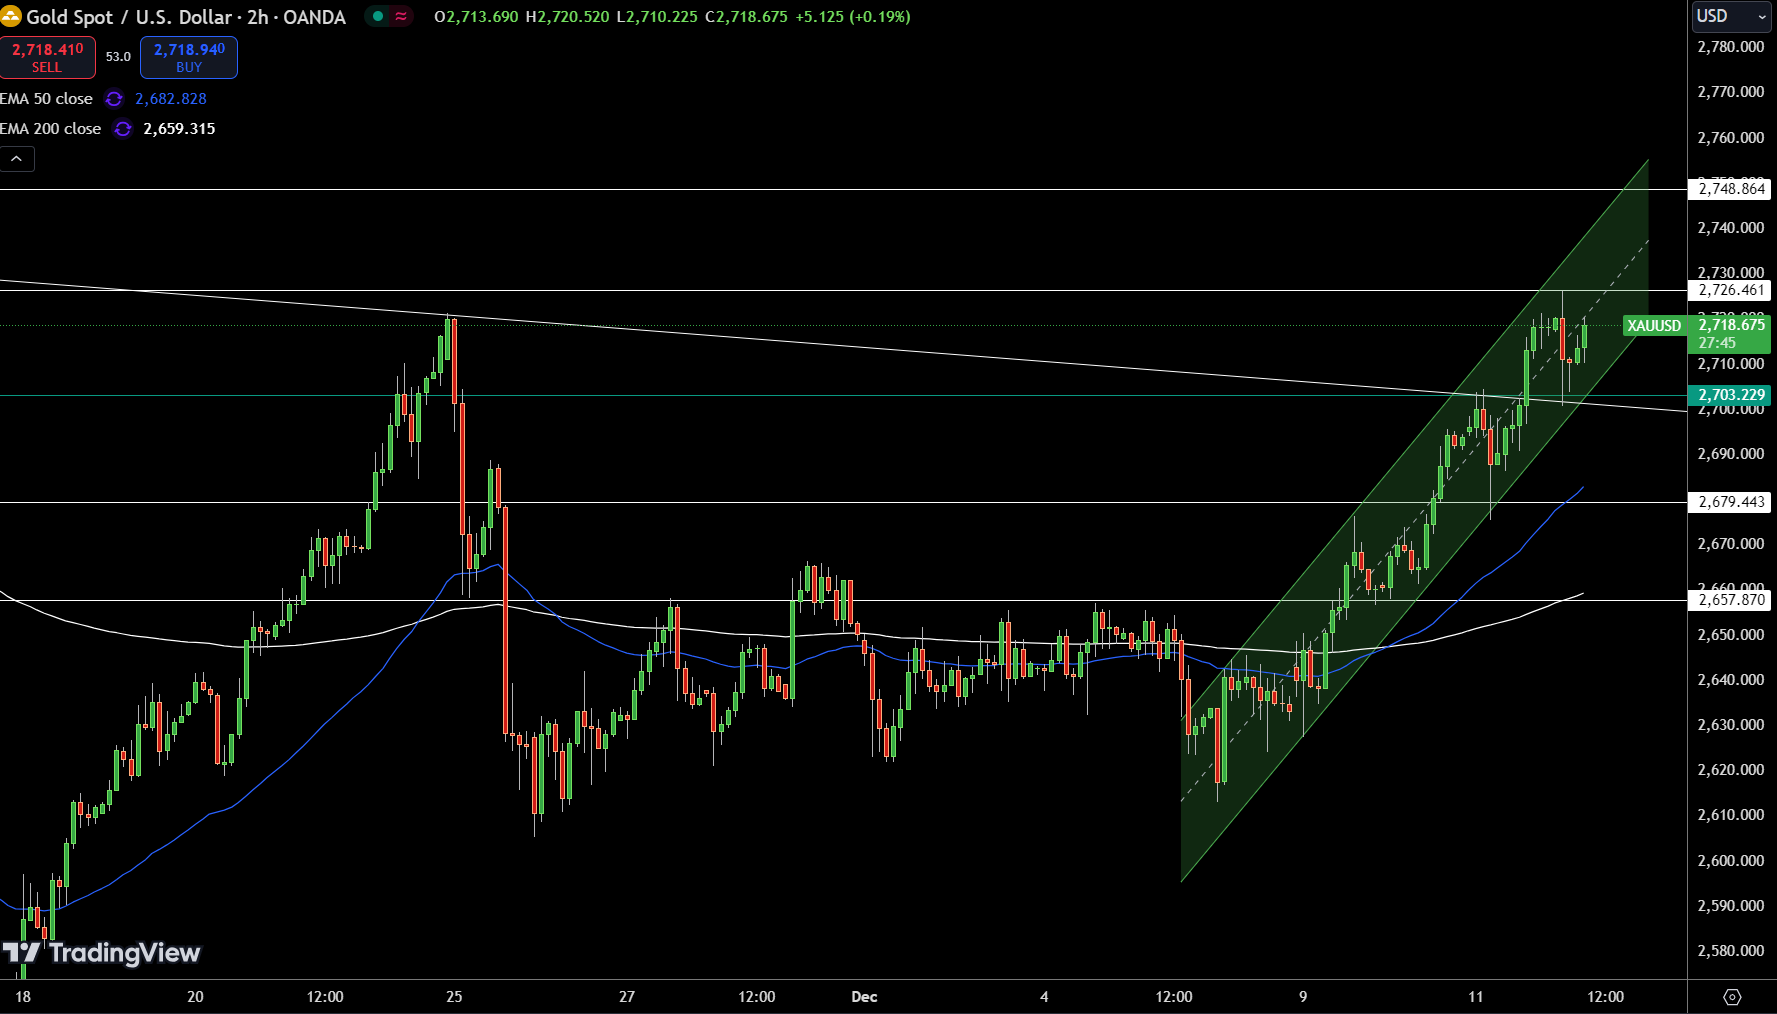
Gold – Chart
Gold (XAU/USD) is trading at $2,716.92, down 0.04%, supported by an upward channel on the 4-hour chart. The pivot at $2,703.23 sustains bullish momentum, with resistance at $2,726.46 and $2,748.86.
Key support lies at $2,679.44 and $2,657.87. The 50-day EMA at $2,682.83 supports the short-term uptrend, while the 200-day EMA at $2,659.32 reinforces long-term strength. A break below $2,703.23 could signal bearish pressure.
Sterling Gains as House Price Balance Hits 25%
The British Pound (GBP) strengthened as the RICS House Price Balance surged to 25%, exceeding the forecast of 19% and the previous 16%. The 10-year bond auction saw a decline in yields to 4.33% from 4.48%, signaling easing borrowing costs.
Markets now anticipate the NIESR GDP Estimate and CB Leading Index for further economic direction. Sterling’s resilience reflects optimism in the housing sector despite broader concerns in economic growth forecasts.
GBP/USD Technical Analysis

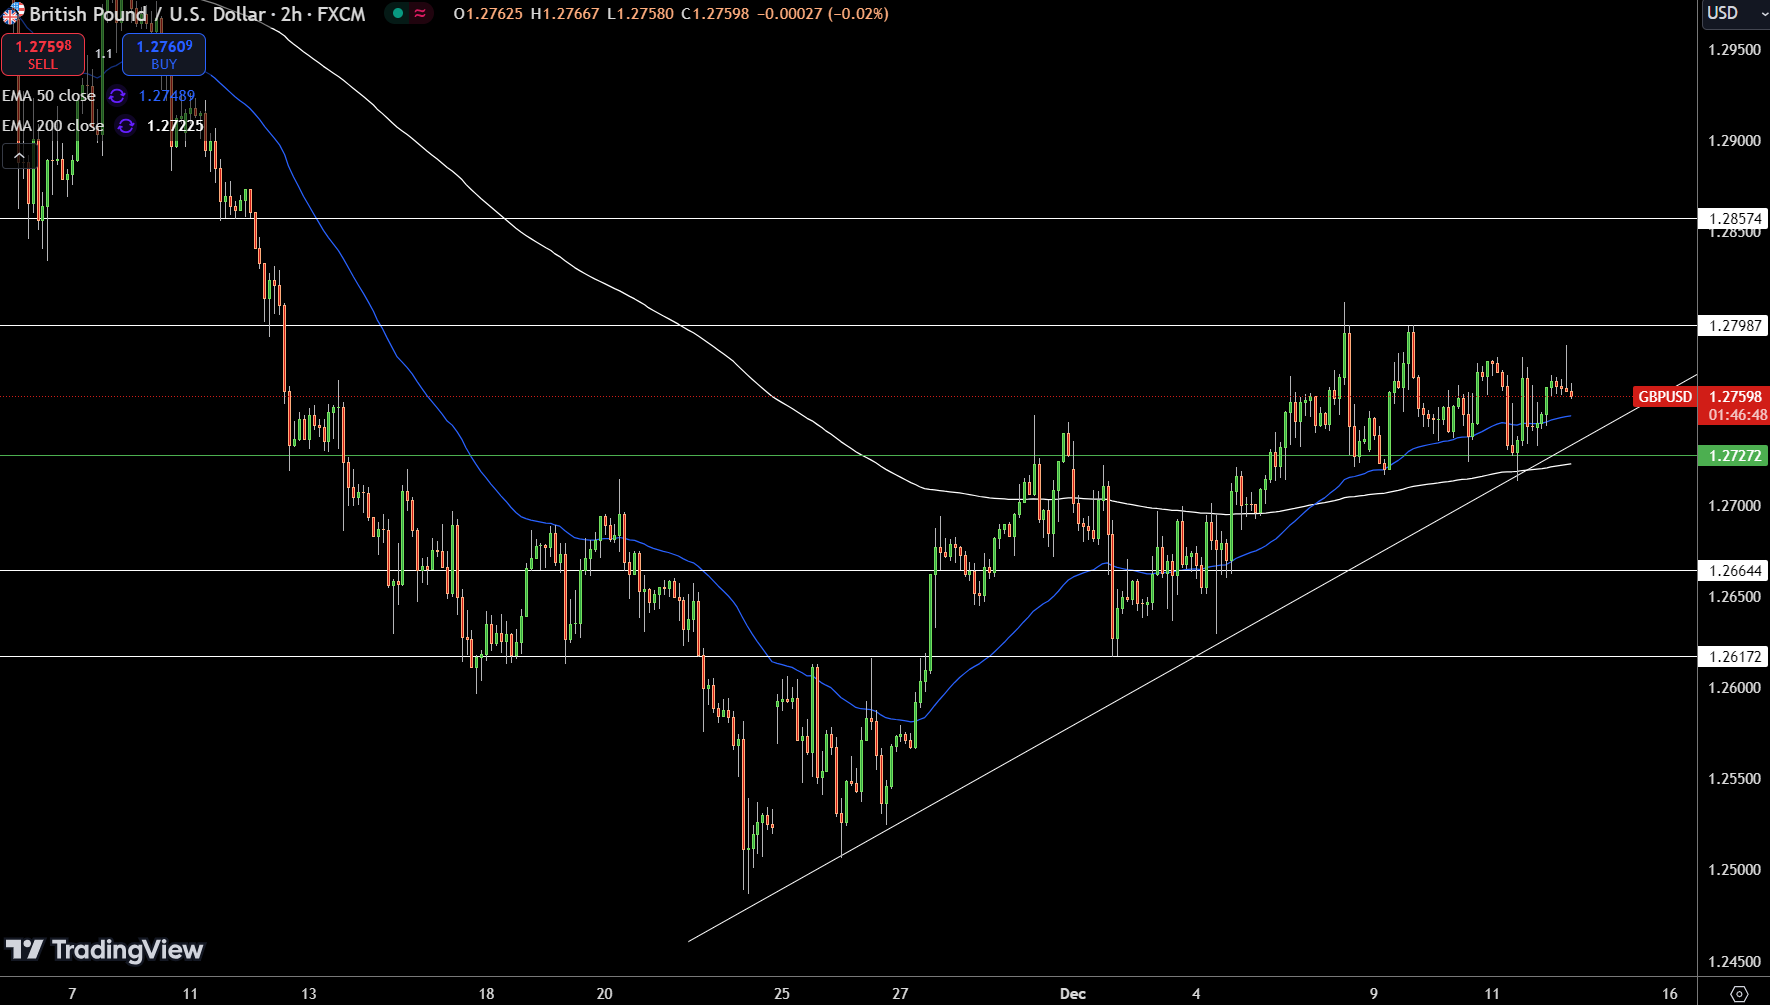
GBP/USD Price Chart – Source: Tradingview
GBP/USD is trading at 1.27609, up 0.08%, maintaining an upward trendline on the 4-hour chart. The pivot point at 1.27272 serves as a key level, with bullish momentum likely above it. Immediate resistance lies at 1.27987, followed by 1.28574, suggesting room for further upside if buyers remain in control.
Support levels are positioned at 1.26644 and 1.26172, providing safety nets in case of a pullback. The 50 EMA at 1.27489 reinforces the bullish outlook in the short term, while the 200 EMA at 1.27225 aligns with broader upward momentum. A break below 1.27272 could shift sentiment, driving sharp selling pressure.
Euro Awaits ECB Decision After Unemployment Falls
The Euro (EUR) awaits pivotal data as the Italian Quarterly Unemployment Rate dropped to 6.6%, beating the 6.8% forecast. Focus now shifts to the European Central Bank (ECB) policy updates.
The Main Refinancing Rate is expected to decline to 3.15% from 3.40%, accompanied by the Monetary Policy Statement and ECB Press Conference.
These events are critical in shaping market sentiment and future monetary policy, potentially driving volatility in the Eurozone’s currency markets.
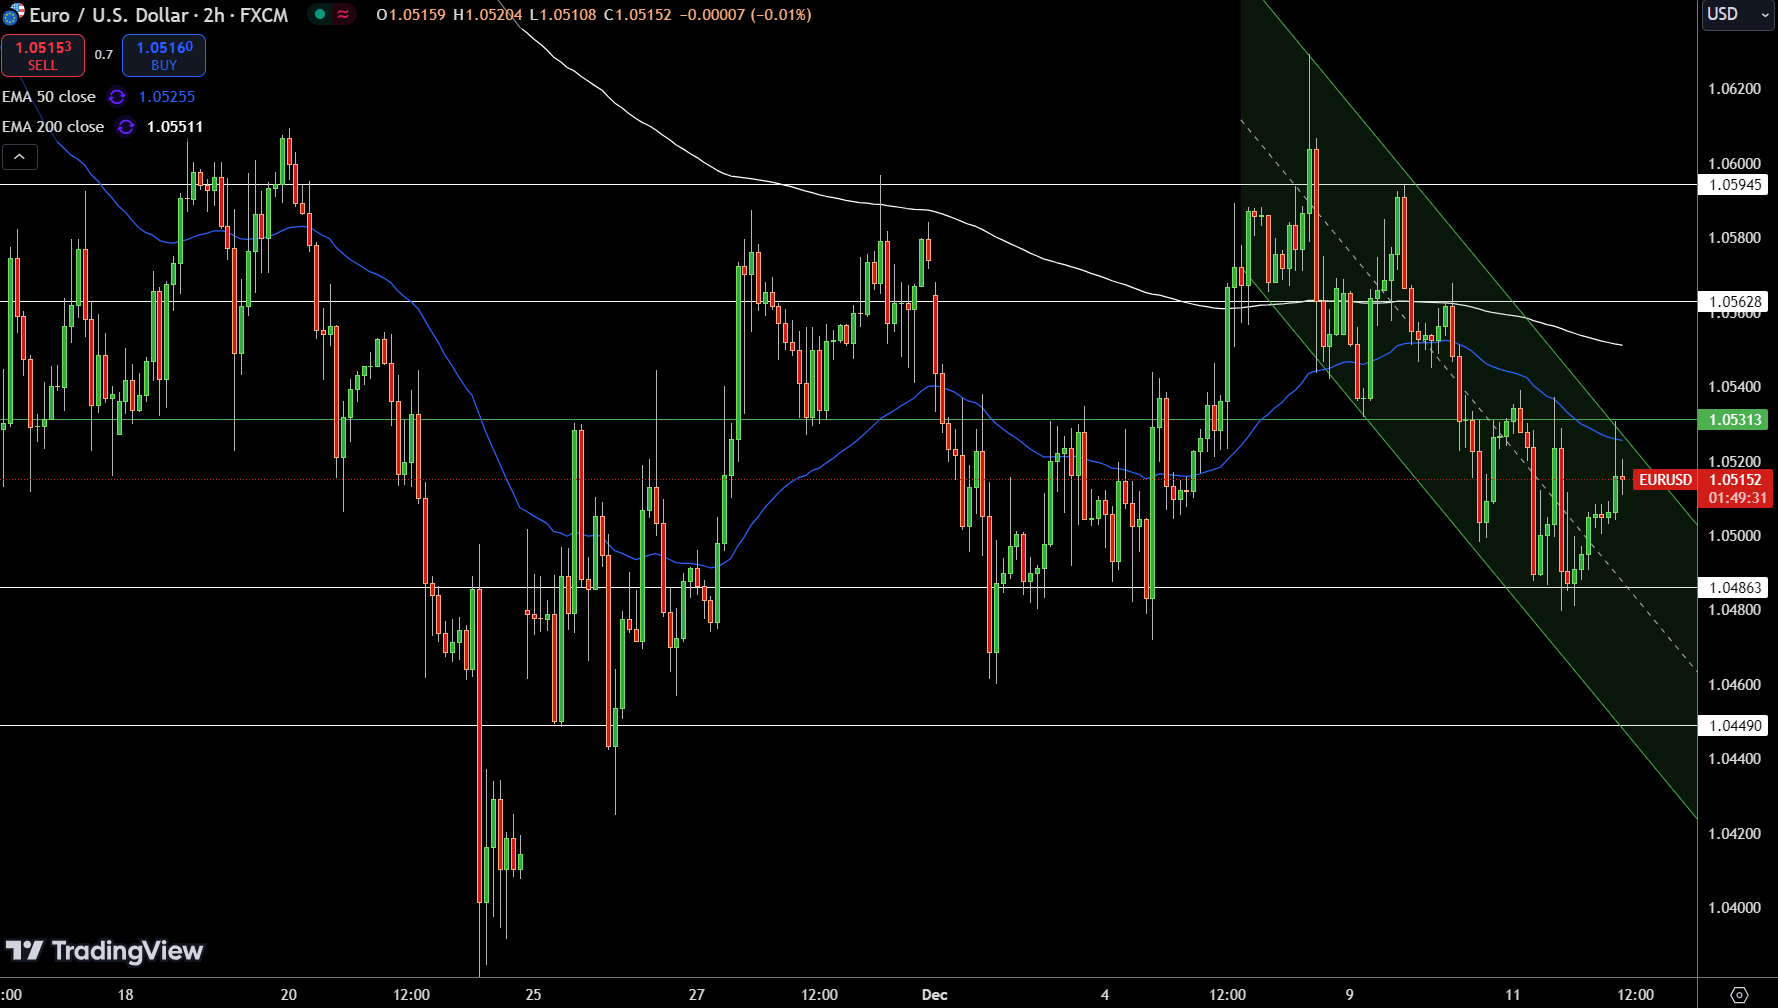
EUR/USD Technical Forecast

EUR/USD is trading at 1.05125, up 0.16%, navigating within a downward channel on the 4-hour chart. The pivot point at 1.05313 is a critical level, dictating the pair’s immediate direction. Below this, the pair faces support at 1.04863 and further at 1.04490. Resistance is positioned at 1.05628 and 1.05945.
Technical indicators suggest mixed sentiment. The 50 EMA at 1.05255 reflects short-term consolidation, while the 200 EMA at 1.05511 highlights a slightly bearish outlook. A break above 1.05313 could challenge resistance levels and signal bullish momentum.
FXEmpire


