Active Trader Breakout Signals for Gold, Silver & Oil
Gold, Silver and Oil breaks out to new multi week highs and shows signs of more strength to come. The charts below show both weekly and daily trading analysis pointing to higher prices for these commodities.
Weekly Gold ETF Trading
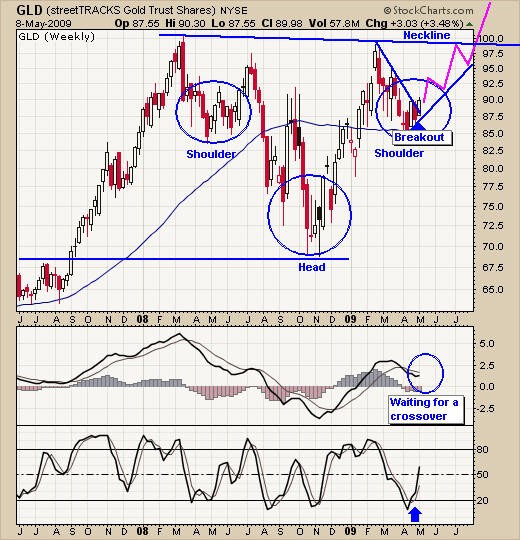
Gold closed on Friday at a 5 week high, breaking above its resistance trend line on the weekly chart. Weekly chart pattern breakouts carry much more momentum behind a move, than daily charts. This chart of gold (GLD fund) clearly shows a weekly breakout in the price of gold.
Also, I have drawn what appears to be a very large reverse Head & Shoulders pattern. It is this pattern, which is pointing to a much higher price for gold. The measured move for this pattern is the distance from the Bottom (head) to the top (neckline), which is about $300 per ounce. If we see this chart break above the neckline over the next few months, then most technical traders will be buying gold up to $1300 per ounce, which would be the next major price target.
Weekly Gold ETF Trading - GLD ETF Fund - Price of Gold
Daily Gold ETF Trading
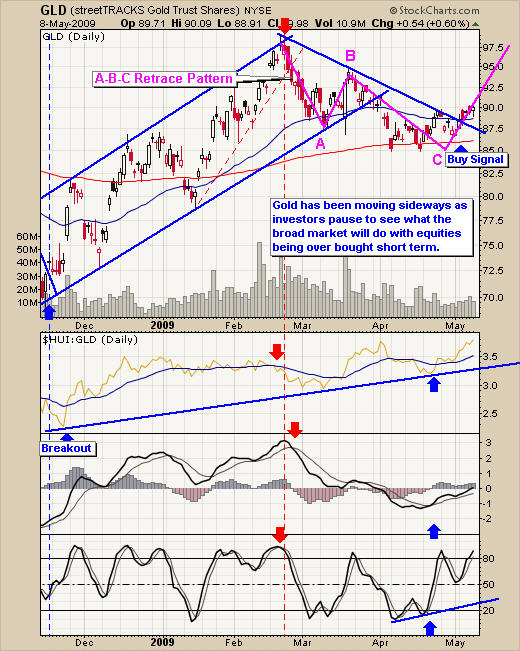
The daily chart breaks down the price action even more, allowing us to see the price movement for each day. This chart looks to be very strong, generating a buy signal for gold.
The $HUI:GLD indicator shows gold stocks are out performing the price of gold, which is very positive. The MACD and stochastic indicators are currently on a buy signals as well. When we combine these indicators with current price action, trend lines and risk management, we can find low risk entry points for trading in and out of gold.
Daily Gold ETF Trading - GLD ETF Fund - Price of Gold
Weekly Silver ETF Trading
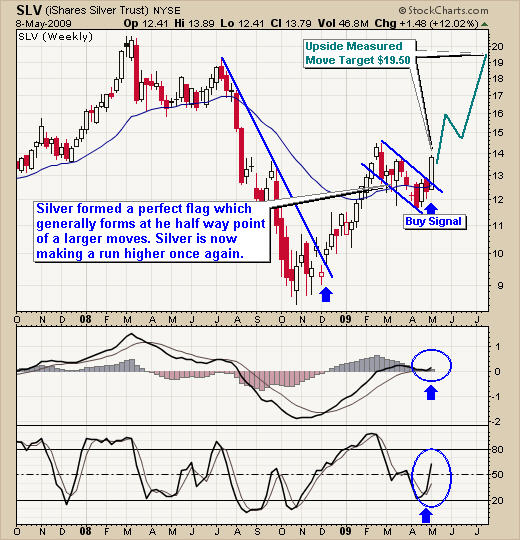
Silver has much of the same price action as gold. Both are considered a safe haven and seem poised to move higher over the intermediate term. The weekly chart below shows silver breaking above its resistance trend line and surging higher in price.
Sometimes I see silver as a leading indicator for the price of gold. Gold only moved higher by 3.5% on Friday while silver surged over 12%. I expect to see gold catch up over the next week as new traders/investors see these clear breakouts.
Weekly ETF Trading - SLV ETF Fund - Price of Silver
Daily Silver ETF Trading
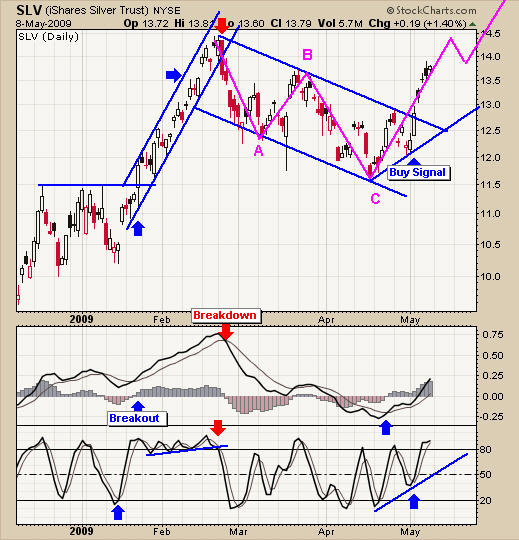
The daily chart for silver looks strong as well, but could be a little ahead of its self. We may see is pause for a day or two before continuing its move higher.
Daily Silver ETF Trading - SLV ETF Fund - Price of Silver
Crude Oil Trading
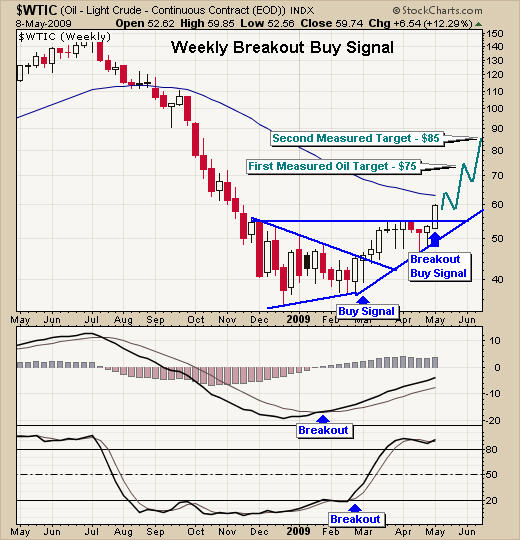
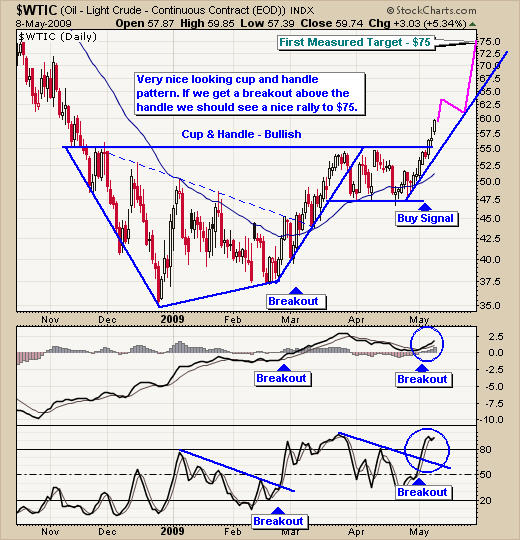
The last week in oil was exciting with prices breaking out and starting to run higher. The cup & handle pattern for oil can be seen best looking at the daily chart. The measured move for the price of oil looks to be around the $75 level and then $85 after that. The cup & handle pattern is one of most powerful bottoming patterns and I expect oil will trade higher for some time.
Weekly Oil Trading - How to Trade Oil (USO, USL) - Price of Oil
Daily Oil Trading
The daily chart shows a clear picture of the cup & handle pattern. During this pattern, we have had two buy signals. I like to wait for low risk entry points when risk is under 3% and currently downside risk for trading oil at this level, is around 8%.
Waiting for low risk entry points with clear exit points is critical for trading commodities. Every one can buy gold, silver and oil but most don't know when to cut losses, take profits or when to add to a winning position. That is what I focus on when trading these volatile commodities.
Daily Oil Trading - How to Trade Oil (USO, USL) - Price of Oil
TheGoldAndOilGuy's Trading Conclusion
The commodities market has been extra volatile the past 9 months making it difficult to have low risk setups. We have been getting several buy signals but not as many setups to actually put money to work because risk has been over 3%.
I think these commodities gold, silver, and oil are poised for a nice move higher. I just want to mention I am not a gold or silver bug always thinking they will rally to ridiculous prices like $8,000, which several forecasters are shouting out. I like to follow the price one - two moves at a time then review the current situation.
That being said, with the global economy not looking to hot, it puts gold and silver in a great situation. Countries, and private investors and traders are accumulating precious metals, as protection from falling currencies and will most likely continue doing this for some time, which will continue to push gold and silver higher.
If the broad equities market rolls over, I expect to see gold move higher with money moving into these safe havens. So, I think the odds are good for prices to rise over the next 4-8 weeks.
Oil appears to be in a similar situation. If oil prices continue to climb, I expect it will put a damper on the equities market, which will help push gold and silver higher.
While I would like to see prices move higher for all investment types, it's important that traders and investors protect themselves from substantial loses. I focus on following price action, volume, momentum, risk management (Low Risk Setups), portfolio allocation and some fundamental data, but in my opinion most fundaments have gone out the window.


